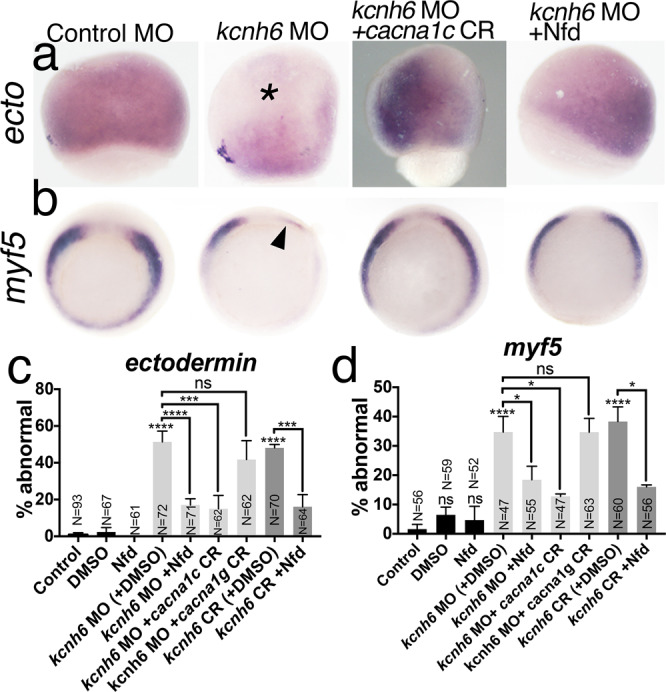
Fig. 5. The role of VGCCs in germlayer differentiation.

a WMISH for ectodermin; lateral views with the animal pole to the top; asterisk marks the animal pole with loss of ectodermin expression; embryos with absent expression are quantified in c; CR CRISPR, Nfd nifedipine. b WMISH for myf5: vegetal views with dorsal to the top; arrowhead marks loss of expression; embryos with abnormal expression are quantified in d. c, d Percentages of embryos with abnormal ectodermin (c) and myf5 (d) expression. Graphs depict mean ± SEM; p-values are in c: (kcnh6MO+DMSO vs DMSO) = 2.88e-006, (kcnh6MO+Nfd vs kcnh6MO+DMSO) = 4.59e-002, (kcnh6MO+cacna1cCR vs kcnh6MO) = 1.53e-002, (kcnh6MO+cacna1gCR vs kcnh6MO) > 9.99e-001 (ns), (kcnh6CR+DMSO vs DMSO) = 3.50e-007, (kcnh6CR+Nfd vs kcnh6CR+DMSO) = 1.20e-002; in d: p-values are (kcnh6MO+DMSO vs DMSO) = 4.07e-015, (kcnh6MO+Nfd vs kcnh6MO+DMSO) = 8.92e-005, (kcnh6MO+cacna1cCR vs kcnh6MO) = 4.78e-005, (kcnh6MO+cacna1gCR vs kcnh6MO) = 2.24e-001 (ns), (kcnh6CR+DMSO) = 2.04e-014, (kcnh6CR+Nfd) = 1.45e-003; two-sided Fisher’s exact test; total embryo numbers (N) in the graphs are from at least 2 independent experiments; Key for asterisks: *p ≤ 0.05, ***p ≤ 0.001, ****p ≤ 0.0001, ns nonsignificant for p > 0.05. Source data are provided as a Source Data file.
