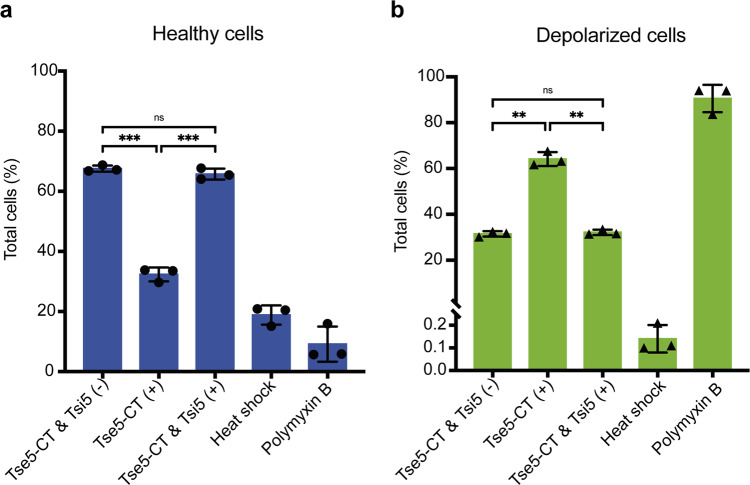
Fig. 3. Tsi5 can protect from Tse5-induced membrane depolarisation.
Flow cytometry experiments were performed with P. putida cells harbouring plasmids directing the expression of Tse5-CT (Tse5-CT+) or Tse5-CT and Tsi5 (Tse5-CT+ and Tsi5+). As a negative control, the graphs include the flow cytometry results of cells transformed with pS238D1::tse5-CT and pSEVA424::tsi5 plasmids and without inducing the expression of the proteins (Tse5-CT− and Tsi5−). Each graph includes two positive controls: cells treated with a heat shock that results in cell permeabilization and cells treated with polymyxin B, which results in cell depolarisation. a Flow cytometry results showing healthy cell populations. Healthy cells are not marked with any fluorophore. b Flow cytometry data show depolarised cell populations. Depolarised cells stain with DiBAC4(3). All measurements were made in triplicate (n = 3 biological replicates). The graphs show the mean values and ± standard deviations (SD). The one-way ANOVA (Brown–Forsythe ANOVA test) with Dunnett´s T3 multiple comparisons test was used to determine whether there is a significant difference between the mean values of our independent groups (non-significant [ns] if p > 0,05, * if p ≤ 0.05, ** if p ≤ 0.01, *** if p ≤ 0.001).

