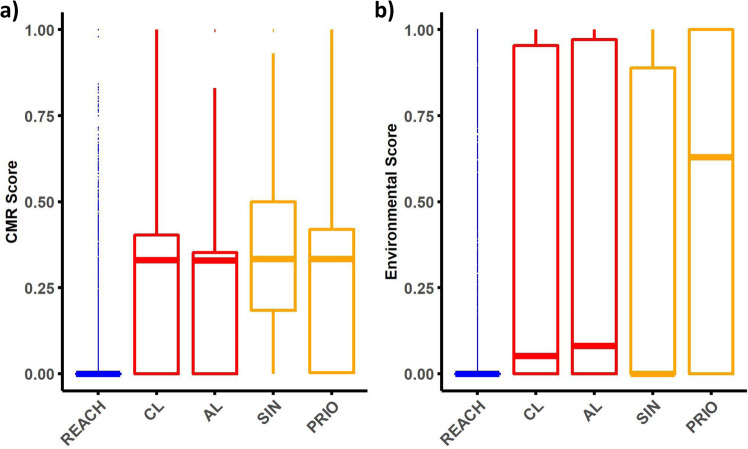
Fig. 1. Distribution of CMR and Environmental Score across chemical lists.
Panels (a) and (b) present the distribution of the CMR Score, measuring Carcinogenicity (C), Mutagenicity (M), and Reproductive toxicity (R), and the Environmental Score, measuring environmental hazard, across the five examined chemical lists. Note that some compounds could not be assigned a score as there was no matching entry in the classification and labeling inventory. Sample size (a): European chemical regulation Registration, Evaluation, Authorization, and Restriction of Chemicals (REACH, n = 16,846), Candidate List (CL, n = 247), Authorization List (AL, n = 79), SIN List (SIN, n = 877), PRIO List (PRIO, n = 848). The parallel bars represent the median value while the hinges show the first and third quartiles. The whisker extends 1.5 inter-quartile ranges from the hinge. Outliers are plotted as individual points.

