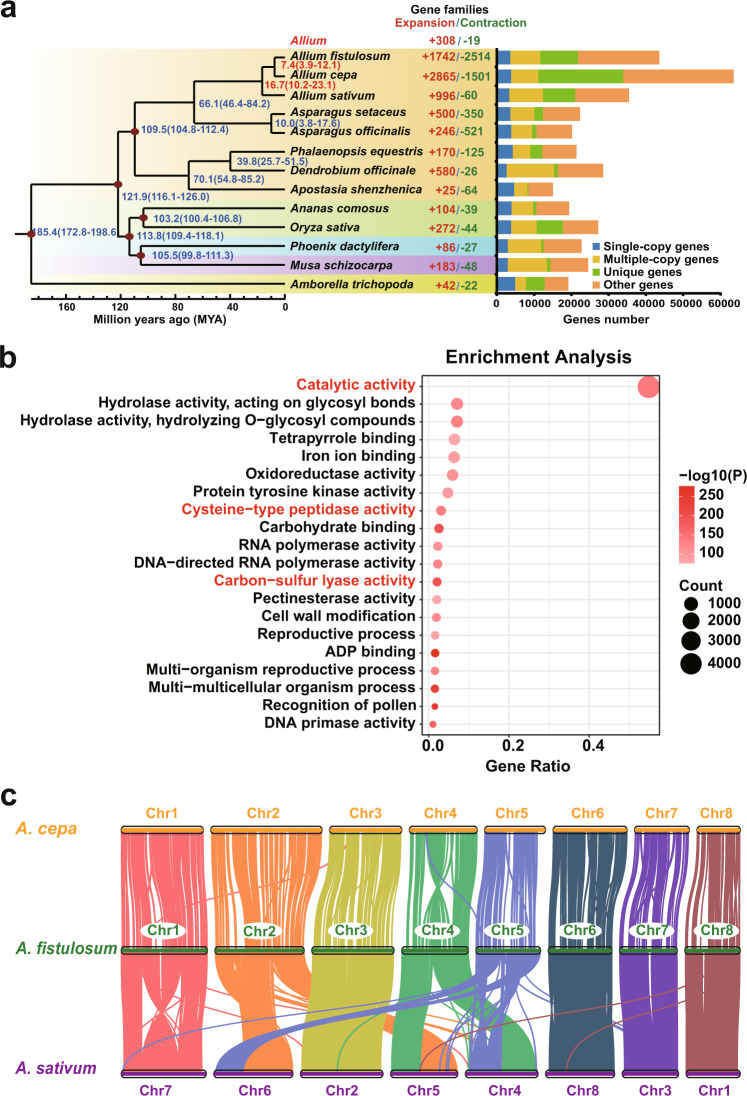
Fig. 2. Genome evolution and relatedness of Allium crops.
a The phylogenetic tree of 13 plant species and the evolution of the gene families. Numerical values besides each node show the estimated divergence time of each node. The red dots on the nods indicate the existence of fossil evidence that supported the estimated time. The numbers in the middle panel indicated the expanded and contracted gene families. The right panel displays the gene number of single-copy, multiple-copy, unique and other orthologues. b The top-20 enriched Gene Ontology terms of the shared expanded genes in three Allium crops. Chi-square test was used to calculate the P-values of the gene terms when all the expected frequency were higher than five, otherwise, we used Fisher’s exact test to calculate the P-values. c Genomic collinearity between three Allium crops. Source data are provided as a Source Data file.

