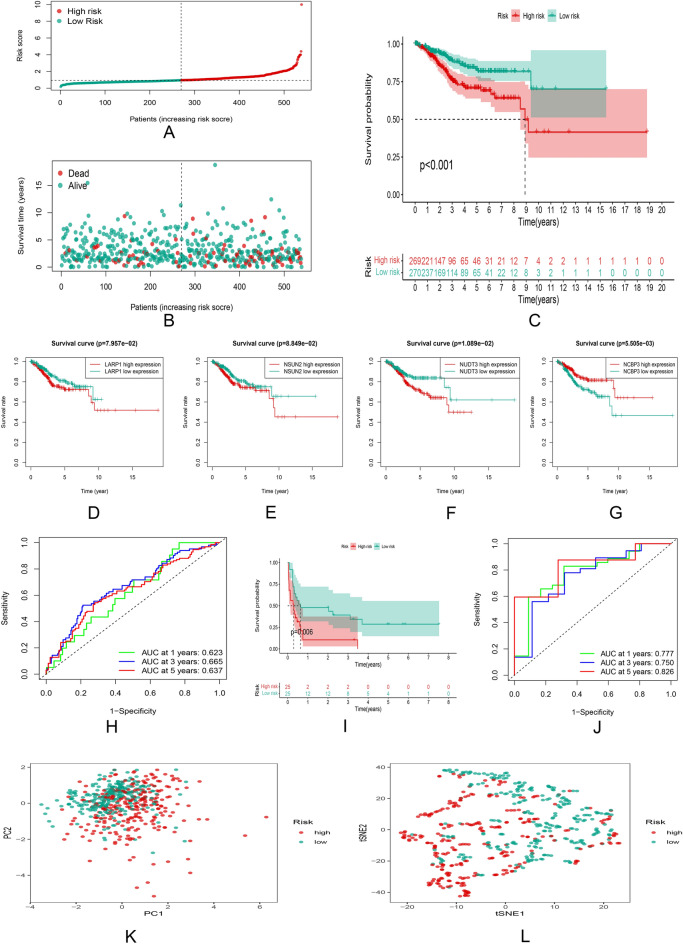
Figure 4.
Survival analysis and comparison between the high and low risk groups. (A,B) Median distribution of risk scores and survival status of UCEC patients. (C) Kaplan–Meier survival curves of patients in the high and low risk groups in the TCGA cohort. (D–G) Survival status of high and low expression groups with NSUN2, NUDT3, LARP1 and NCBP3 genes. (H) ROC curves and AUC values of the model in the TCGA cohort. (I) PCA analysis results. (J) t-SNE analysis results.

