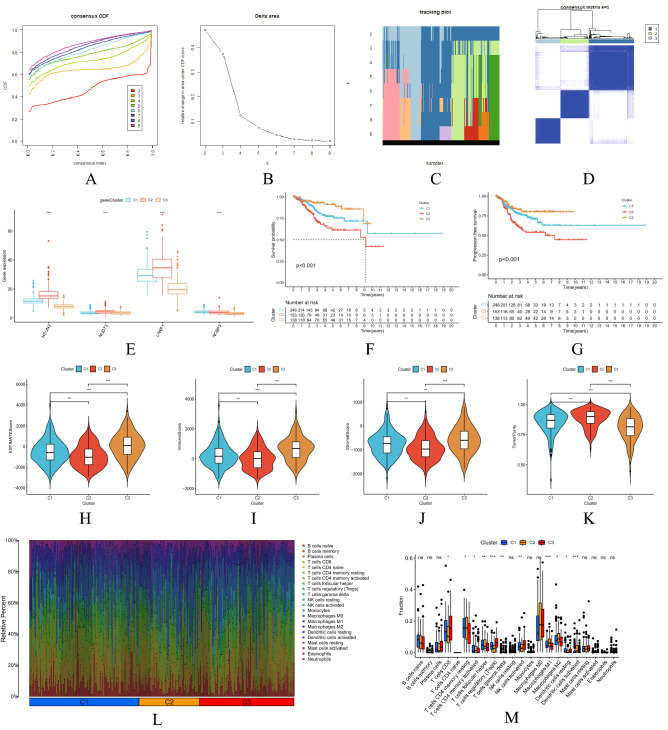
Figure 8.
Survival, TME and immune cell infiltration analysis of consensus clustering recognition and typing. (A) Consensus clustering CDFs of k = 2–9. (B) Relative change in area under CDF curve of k = 2–9. (C) Tracking plot of k = 2–9. (D) Consensus clustering matrix of k = 3. (E) Differential distribution of 4 prognostic risk genes in 3 types among the three groups with respect to OS (F) and PFS (G) Kaplan–Meier survival curve. (H) ESTIMATEScore. (I) ImmuneScore; (J) StromalScore. (K) TumorPurity; Principal component analysis plot of immune cell infiltration matrix of 3 types (L) and variance analysis plot (M).

