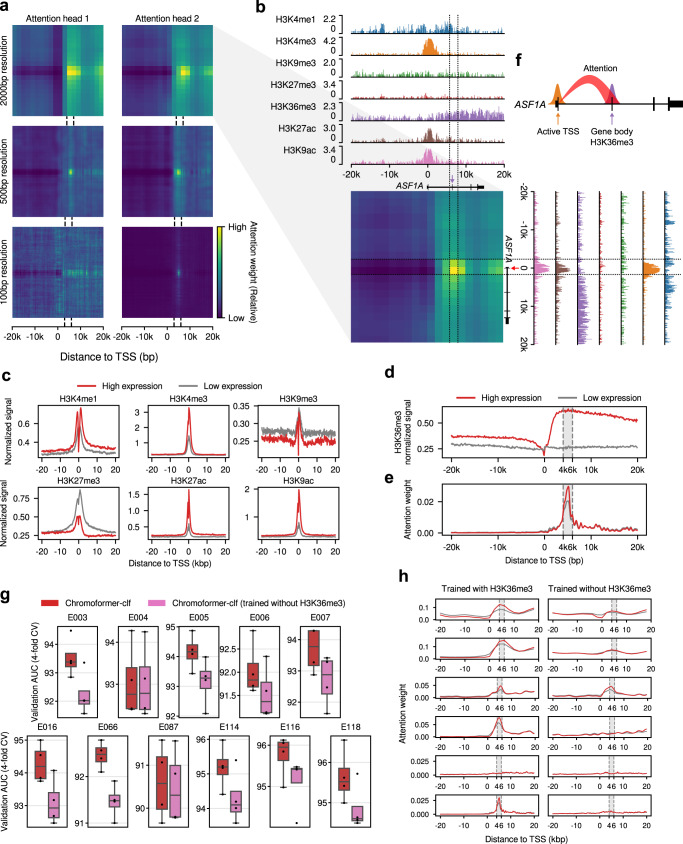
Fig. 4. Analysis of self-attention weights learned by the Embedding transformer.
a Representative self-attention weight matrices for the prediction of the expression of ASF1A in H1 cell. Each heatmap shows the attention weight for each pair of genomic bins. The dotted lines indicate the 4–6 kbp region downstream TSS. b Detailed description of the attention weights learned by the attention head 2 for 2 kbp-resolution Embedding transformer. Genome tracks representing the normalized signals of the seven HMs are aligned with the attention weight matrix. The dotted lines demarcate the regions 4–6 kbp downstream the TSS. The red arrow indicates the TSS, and the purple arrow indicates the exon located within the region 4–6 kbp downstream the TSS. c Average signals of the HMs other than H3K36me3. Signals were separately averaged according to their expression labels (High/Low expression). d Average H3K36me3 signal. e Average attention weights of the second attention head for 100 bp resolution bins. The grey shade denotes the 4–6 kbp region downstream the TSS. f Schematic diagram illustrating the behavior of the Embedding transformer. g Cross-validation (n = 4) performances upon H3K36me3 feature ablation. The center line denotes the median, the upper and lower box limits denote upper and lower quartiles, and the whiskers denote 1.5× interquartile range. h Attention weights for TSS bin. Red and grey lines indicate the average attention weights for genes having above-median and below-median expression, respectively. Source data are provided as a Source Data file.

