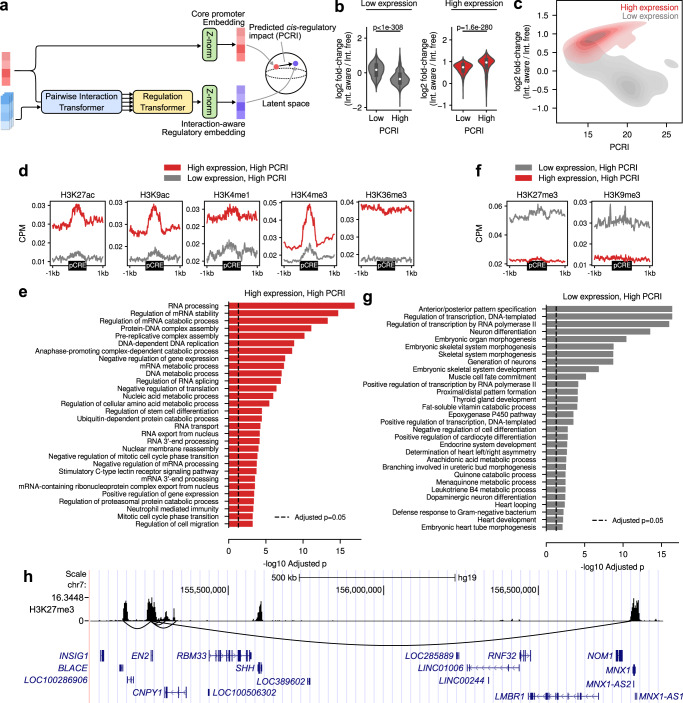
Fig. 5. Analysis of predicted cis-regulatory impact (PCRI).
a Schematic diagram illustrating the computation of the PCRI. b, c Relationship between PCRI and the log2 fold-change of predicted gene expression between the interaction-aware and interaction-free Chromoformer-reg in H1 cells (Epigenome identifier E003). Low and high PCRI groups were split by the median PCRI value. In b, p-values from two-sided Wilcoxon rank-sum tests between genes with below-median PCRI (n = 4739 for both low and high expression groups) and above-median PCRI (n = 4738 and 4739 for low and high expression groups, respectively) are shown. In the boxes within the violinplot, the white point denotes the median and the upper and lower box limits denote upper and lower quartiles. d Average HM signals near the pCREs interacting with top 1000 genes with the highest PCRI among highly and lowly expressed genes. e Functional enrichment analysis of the top 1000 genes with the highest PCRI among highly expressed genes in H1 cells. Benjamini-Hochberg adjusted Fisher’s exact p-values are shown in negative logarithmic scale. f Average HM signals near the pCREs interacting with top 1000 genes with the highest PCRI among highly and lowly expressed genes. g Functional enrichment analysis of the top 1000 genes with the highest PCRI among lowly expressed genes in H1 cells. Benjamini-Hochberg adjusted Fisher’s exact p-values are shown in a negative logarithmic scale. h Representative genomic region showing suppressive cis-regulatory interactions for EN2. Black curved lines below the H3K27me3 signal track shows the 3D chromatin interactions centered at the core promoter of EN2. NCBI RefSeq gene annotations are shown at the bottom. Source data are provided as a Source Data file.

