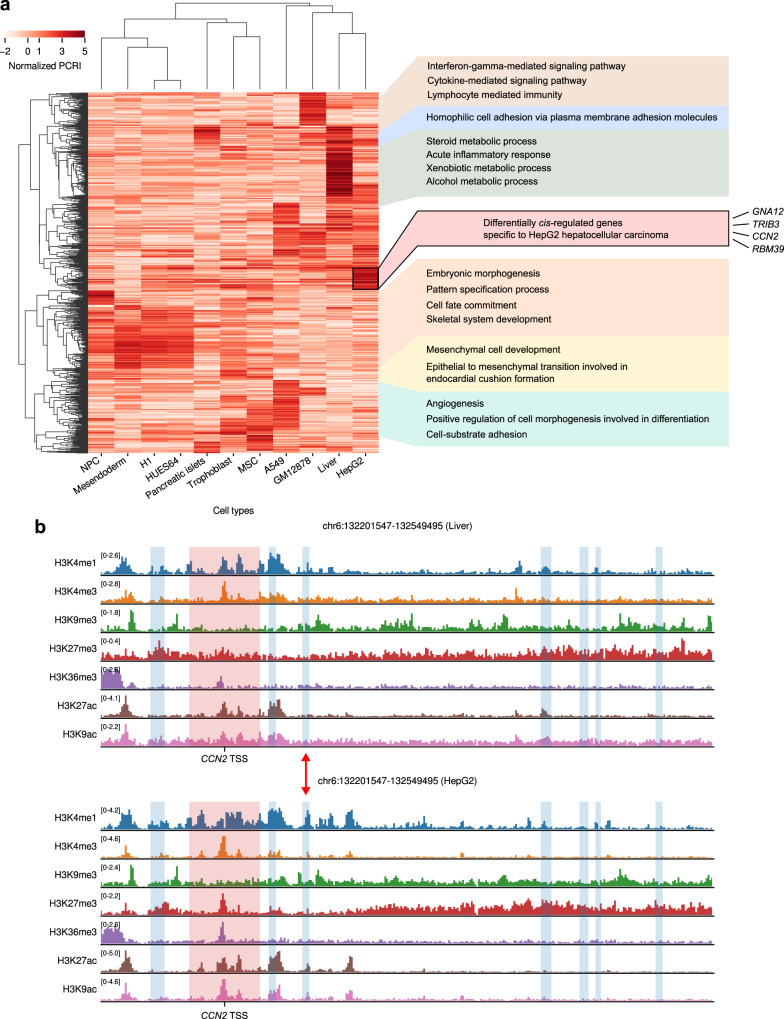
Fig. 6. Differential cis-regulome analysis using PCRI values.
a Hierarchical clustering of top 1000 genes having the highest normalized PCRI variances across cell types. Representative GO terms enriched for the corresponding set of genes are shown on the right. b Histone modification landscape around the transcription start site of CCN2 and its pCREs in Liver (E066) and HepG2 (E118) cells. Red shades denote promoter regions and blue shades denote pCRE regions interacting with the promoter. Red arrow represents a putative enhancer region that seems to be only active in HepG2 cells. Source data are provided as a Source Data file.

