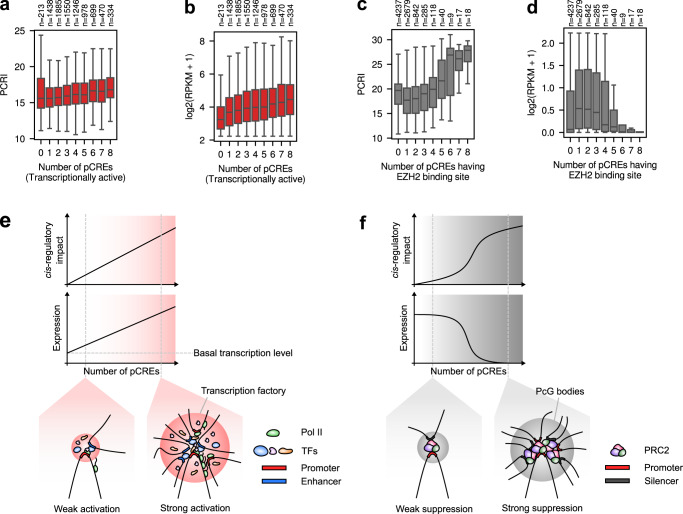
Fig. 7. Characteristics of cis-regulation learned by Chromoformer.
a Association between the number of transcriptionally active pCREs and PCRI. b Association between the number of transcriptionally active pCREs and gene expression level. c Association between the number of pCREs harboring EZH2 binding sites and PCRI. d Association between the number of pCREs harboring EZH2 binding sites and gene expression level. Throughout a-d, the number of genes having the corresponding number of pCREs are shown above the plot. In the boxplots, the center line denotes the median, the upper and lower box limits denote upper and lower quartiles, and the whiskers denote 1.5× interquartile range. e, f Illustrations for the proposed hypothetical models for regulatory dynamics of e transcription factories and f silencing hubs are shown. Pol II, RNA polymerase II; PcG bodies, Polycomb group bodies; PRC2, Polycomb repressive complex 2. Source data are provided as a Source Data file.

