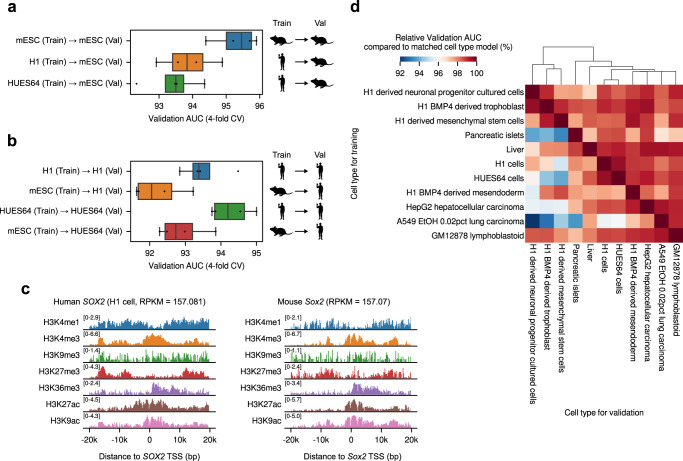
Fig. 8. Cross-species and cross-cell type prediction performances of Chromoformer.
a, b Cross-species prediction performances of Chromoformer-clf models. a Cross-validation (n = 4) performances of Chromoformer-clf models, trained with ES-Bruce4 mouse embryonic stem cells (mESC) or human embryonic stem cells (hESCs), are shown for the prediction of (a) mESC gene expression and (b) hESC gene expression. In the boxplot, the center line denotes the median, upper and lower box limits denote upper and lower quartiles, and whiskers denote 1.5× interquartile range. c Log2-transformed histone modification signals surrounding human SOX2 TSS and mouse Sox2 TSS. d Cross-cell type gene expression prediction performances. Colors represent the relative validation AUC compared to the matched cell type Chromoformer-clf model (i.e., trained and evaluated for the same cell type). Val, Validation. Source data are provided as a Source Data file.

