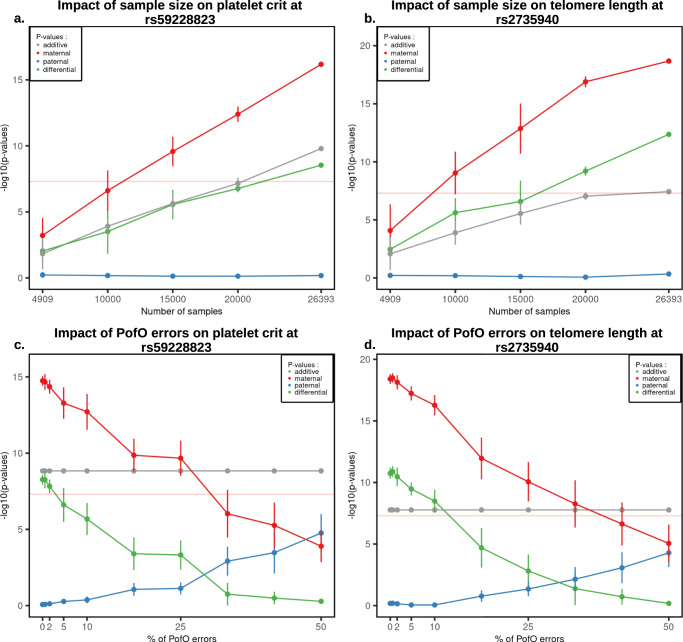
Fig. 5. Robustness of the PofO testing.
a, b Association strength as −log10(p-value) for rs59228823 and rs2735940 (y-axis) on platelet crit and TL, respectively, as a function of the number of randomly chosen samples included in the analysis under the additive (black), paternal (blue), maternal (red) and differential (green) scans. Each point for N = [10,000; 15,000; 20,000] represents the median p-value obtained after 10 randomizations with vertical bars representing the standard error. Points for N = 4909 and N = 26,393 represent the p-values obtained using only the samples with genotyped parents and using our full sample size, respectively. c, d Association strength as −log10(p-value) for rs59228823 and rs2735940 (y-axis) on platelet crit and TL, respectively, as a function of the fraction of samples for which PofO has been randomly drawn (x-axis, 100% = 26,393). Samples included are those for which the PofO has been inferred from the surrogate parents. Each point represents the median p-value obtained after 10 randomizations with vertical bars representing the standard errors. P-values are computed with BOLT-LMM18. Source data are provided as a Source Data file.

