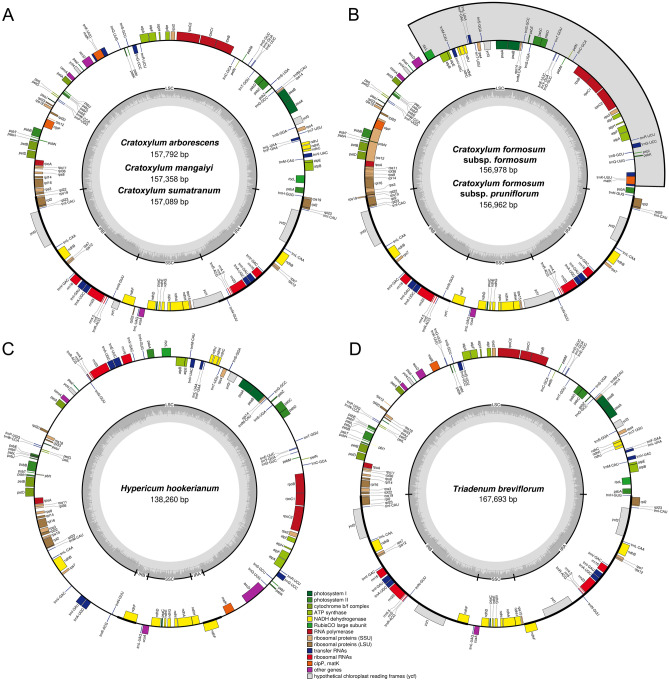
Figure 1.
Genome structure and gene map of the seven taxa of Hypericaceae used in this study. Cratoxylum arborescens, C. maingayi, C. sumatranum (A); Cratoxylum formosum subsp. formosum, C. formosum subsp. pruniflorum (B); Hypericum hookerianum (C); Triadenum breviflorum (D). The inside circle genes are transcribed clockwise, and the outside circle genes are transcribed counter-clockwise. The color codes describe different functional groups of the genes. The thick lines indicate the boundary of the inverted repeats (IRA and IRB), demarcated between the large single-copy (LSC) and small single-copy (SSC) regions. The dark gray area in the inner circle represents genomic GC content, whereas light gray indicates AT content.

