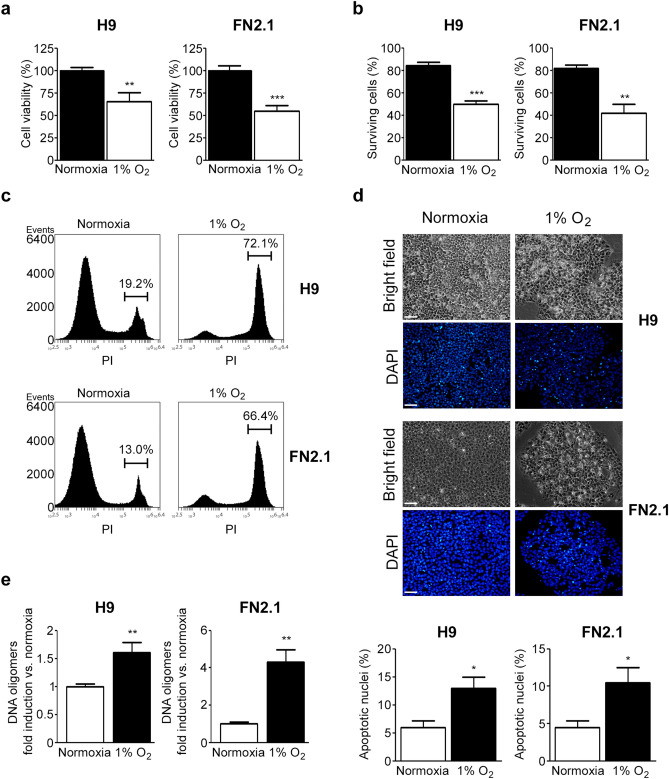
Figure 2.
Changes in cell viability and cell death induced by 1% O2 treatment in hPSCs. (a) H9 and FN2.1 cell viability was analyzed 24 h post 1% O2 treatment by XTT colorimetric assay. Mean + SEM from three independent experiments are shown. Statistical analysis was done by Student’s t-test, (**) p < 0.01 and (***) p < 0.001 versus normoxia. (b) Bar graphs show the percentage of surviving cells assessed by Trypan blue exclusion method 24 h after 1% O2 incubation. Mean + SEM from at least three independent experiments are shown. Statistical analysis was done by Student’s t-test, (**) p < 0.01 and (***) p < 0.001 versus normoxia. (c) Representative histograms of three independent experiments of Propidium iodide (PI) stained H9 and FN2.1 unfixed cells treated for 24 h with 1% O2. The percentage of PI-positive cells (late apoptotic or necrotic) was determined by flow cytometric analysis. (d) Chromatin condensation was analyzed by DAPI staining 24 h after 1% O2. Figure shows representative images and means + SEM from three independent experiments is graphed for % of apoptotic nuclei. The scale bar represents 100 μm. Statistical analysis was done by one-way ANOVAs followed by Student’s t-test, (*) p < 0.05 vs. normoxia. (e) Genomic DNA fragmentation into oligomers of 180–200 bp or multiples of that was quantified in H9 and FN2.1 cells at 24 h post 1% O2 hypoxia induction using a specific ELISA kit. Mean + SEM fold induction relative to normoxia of three independent experiments is shown. Statistical analysis was done by Student’s t-test, (**) p < 0.01 versus normoxia.

