Figure 5.
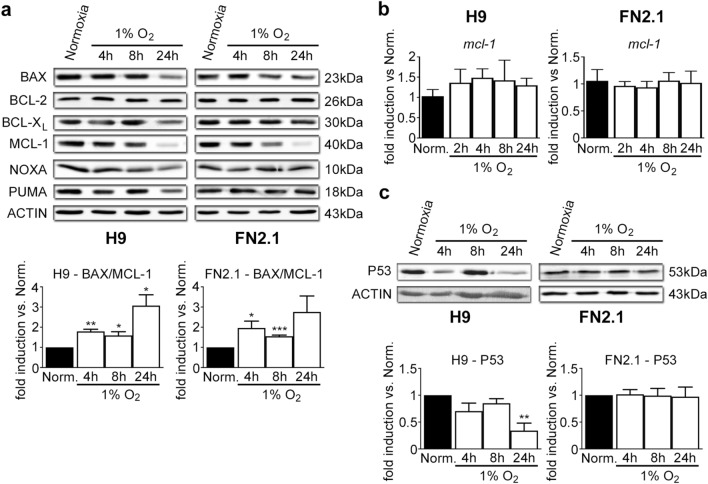
BCL-2 family members and P53 protein expression levels. Expression levels of (a, c) BCL-2 family members, including BCL-XL (anti-apoptotic), BCL-2 (anti-apoptotic), MCL-1 (anti-apoptotic), BAX (pro-apoptotic), NOXA (pro-apoptotic) and PUMA (pro-apoptotic) (a) or P53 (c) were analyzed by western blot in H9 and FN2.1 cells at 4, 8 and 24 h upon 1% O2 hypoxia treatment. ACTIN was used as loading control. Representative blots of three independent experiments are shown (original western blot images are presented in Supplementary Fig. S13, S14, and S15). Bar graphs represent the densitometric quantification of bands. Data are expressed as means + SEM fold induction relative to normoxia (Norm.) and statistical analysis was done by Student’s t-test, (*) p < 0.05, (**) p < 0.01, and (***) p < 0.001 versus normoxia. (b) mRNA expression levels of MCL-1 were analyzed by RT-qPCR at 2, 4, 8, and 24 h upon 1% O2 hypoxia induction. RPL7 expression was used as normalizer. Graph shows mean + SEM mRNA fold induction relative to normoxia (arbitrarily set as 1) from three independent experiments. Statistical analysis was done by Student’s t-test.

