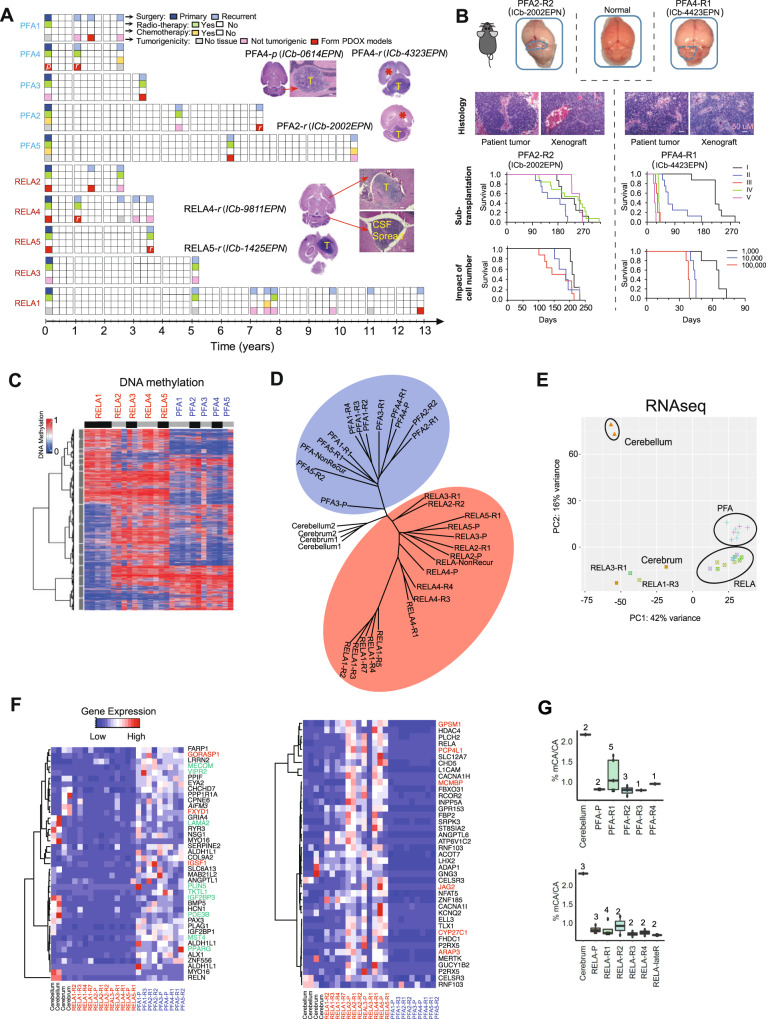
Fig. 1. DNA methylation and transcriptomic landscape of recurrent ependymoma tumors.
A Time-course summary of surgery, radio- and chemotherapy treatment and tumorigenicity information of the 10 sets of recurrent ependymomas. Images of intra-cerebellar (ICb) and intra-cerebral (IC) orthotopic xenograft tumor formation from primary (p) or recurrent (r) PFA and RELA tumors (model ID in round brackets) were inserted to show tumor (T), hydrocephalus (*) and CSF spread. B Orthotopic xenograft mouse models of recurrent PFA EPNs. Tumor formation can be seen on gross (top) mouse brains (outlined). H&E staining (middle) showing histological comparison between the originating patient tumor and the PDOX tumors. Changes of animal survival times (lower panels) during serial in vivo transplanations of intra-cerebellar (ICb) PDOX models from passage I (I) to V (V) and the impact of the implanted different cell numbers (from 1000 cells per mouse to 100,000 cells) on animal survival times of two PDOX models were shown (n = 10 mice/group). Scale bar = 50 µM. C Heatmap showing the DNA methylation ratios of the top variable 20,000 CpGs across all EPN tumor samples. The patient ID is labeled vertically on the top of the heatmap. The black and gray bars under the patient IDs are used to separate tumors from the same patient. D Phylogeny tree construction using the top 6000 CpGs with variable DNA methylation ratios in RELA (red circle) and PFA (blue circle) tumors. E Principle component analysis of RNA-seq data from EPN tumor samples using age matched childhood normal brain tissues as references. F Heatmap representing the PFA (left) and RELA (right) primary tumor signature genes’ expression levels in all samples, including multiple relapses. The primary signature genes were selected from a previously published database GSE6441516,39,88, and those overlapped with our consistently decreased (green) and increased (red) genes were highlighted. G CA methylation ratios in PFA (left) and RELA (lower) primary and recurrent tumors as compared with normal childhood cerebellar and cerebral tissues. Boxplots indicate median, first and third quartiles (Q1 and Q3), whiskers extend to the furthest values; the uppermost and lowest line indicates the maximum and minimum values, respectively. Marked on the top of each boxplot is the number of samples analyzed including Cerebellum (n = 2); Cerebrum (n = 3); PFA-P (n = 2); PFA-R1 (n = 5); PFA-R2 (n = 3); PFA-R3 (n = 1); PFA-R4 (n = 1); RELA-P (n = 3); RELA-R1 (n = 4); RELA-R2 (n = 2); RELA-R3 (n = 2); RELA-R4 (n = 2); RELA-lateR (n = 2).

