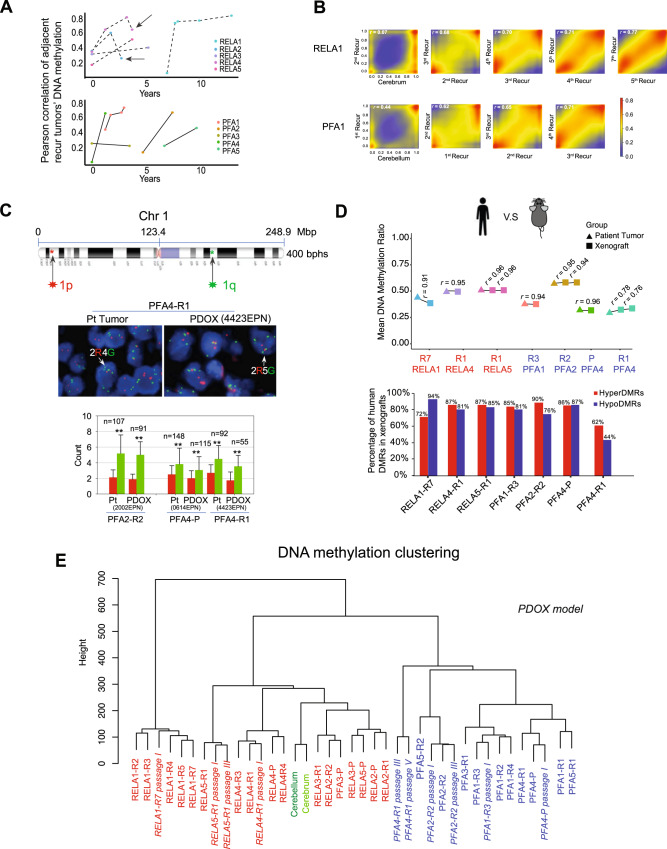
Fig. 2. Progressive convergence of DNA methylation profiles during repeated ependymoma relapses.
A Line charts showing the changes of DNA methylation correlations between adjacent recurrent tumors during repeated recurrences of RELA (upper panel) and PFA (lower panel) tumors. Each dot represents one tumor sample and graphed to the time of recurrence. B Representative smoothed density scatterplots displaying the increased correlation coefficient (r) of DNA methylation profiles between the adjacent recurrent tumors of RELA1 (upper panel) and PFA1 (lower panel) patients. C FISH analysis of chromosome 1q gain showing the locations of FISH probes in 1p (red) and 1q (green) (top), representative images of 1q (G: green) gain relative to 1p (R: red) (middle) in matching pairs of patients (Pt) and PDOX tumors. The number of cells counted (n) was marked on top of the column of every sample (red bar indicates 1p count, and green bar indicates 1q count). Statistical analysis was performed through two-sided Student t-test. **P < 0.01. P-values = 7.7186E-30 (Pt-2002), 5.32303E-34 (ICb-2002EPN), 1.17953E-13 (Pt-0614), 1.5575E-08 (ICb-0614EPN), 4.53091E-21 (Pt-4423), 5.4252E-14 (ICb-4423EPN). Data are presented as mean values ± SD. (Magnification:×100). D Preservation of DNA methylation profiles of patient tumors in their matching PDOX models either from the primary (P) or recurrent tumors from the first (R1) up to the 7th (R7) recurrences. Global Pearson correlation (r) of the DNA methylation profiles from the matched patient tumor and PDOX tumors were labeled above the connected line. The numbers of CpGs used in the correlation analysis were 2,211,714 (RELA1-R7), 2,156,125 (RELA4-R1), 2,075,950 (RELA5-R1), 1,994,148 (PFA1-R3), 2,473,879 (PFA2-R2), 1,728,999 (PFA4-P), and 1,200,936 (PFA4-R1). Majority of the patient DMRs were maintained in their matching PDOX tumors (lower panel). The total numbers of hyperDMRs that were used in the analysis in patient and PDOX tumors are 6919 and 6265 (RELA1-R7), 10,868 and 12,825 (RELA4-R1), 11,406 and 14,333 (RELA-R1)m 5815 and 6653 (PFA-R3), 13,541 and 15,036 (PFA2-R2), 4107 and 8309 (RFA4-P), 3155 and 8373 (RFA4-R1); whereas the total numbers of hypoDMRs were 15,147 and 27,594 (RELA1-R7), 5797 and 8506 (RELA4-R1), 4361 and 7009 (RELA-R1), 12,051 and 15,519 (PFA-R3), 5824 and 5847 (PFA2-R2), 5373 and 10,917 (RFA4-P), 8969 and 10,050 (RFA4-R1), respectively. E Unsupervised clustering of primary/recurrent tumors from the first (-R1) up to the 7th (-R7) relapse as well as matching PDOX tumors at specific passages (passage).

