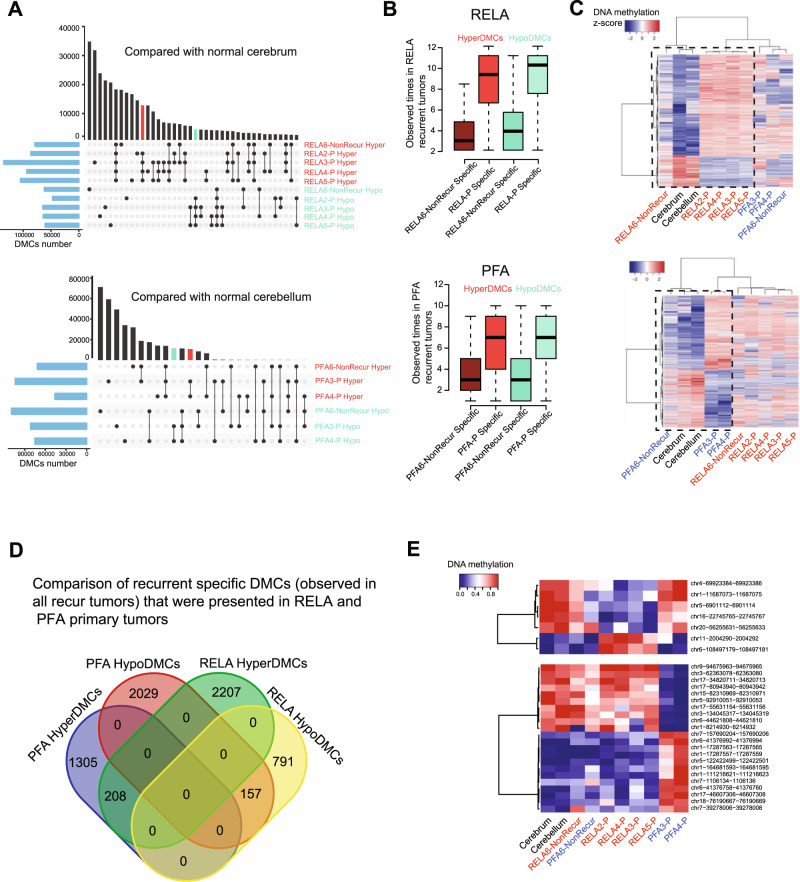
Fig. 5. Identification of DNA methylation predictors of recurrence in primary ependymoma tumors.
A UpSet R plot showing the hyper- and hypo-methylated CpGs sites (DMCs) in RELA (upper panel) and PFA (lower panel) primary tumors (-P) as compared with normal cerebrum or cerebellum tissues. The horizonal histogram represents the number of DMCs in each comparison between primary tumor and normal brain tissues; the vertical histogram represents the number of DMCs shared by tumors marked by connected dots. Red and green bar highlights the hyper- and hypoDMCs that were shared by all the tumors that eventually recurred (primary-tumorEventually recurred) but not in the normal brain tissues and the non-recurrent reference tumors. B Bar graph showing the frequencies of hyper- and hypoDMCs specific to ependymoma primary tumors that eventually recurred (-P-Specific) and that did not relapse (-NonRecur Specific) in the RELA recurrent (n = 12) and PFA (n = 10) recurrent tumors. Boxplots indicate median, first and third quartiles (Q1 and Q3), whiskers extend to the furthest values; the uppermost and lowest line indicates the maximum and minimum values, respectively. In RELA tumors, the numbers of HyperDMCs analyzed are RELA6- NonRecurSpecific (n = 10,309 CpGs), RELA-P-specific (n = 357,141 CpGs); wherease of the HypoDMCs are RELA6-NonRecurSpecific (n = 17,188 CpGs) and RELA-P-specific (n = 507,987 CpGs). In PFA tumors, the HyperDMCs analyzed are PFA6-NonRecurSpecific (n = 24,296 CpGs) and PFA-P-specific (n = 349,746 CpGs); and HypoDMCs PFA6NonRecurSpecific (n = 40,525 CpGs); PFA-P-specific (n = 451,426 CpGs). C Heatmap showing the DNA methylation ratios of DMCs specific to RELA (upper panel) or PFA (lower panel) primary tumorsEventually recurred exist in all recurrent tumors. Black dash box shows that these DMCs have similar DNA methylation ratios among RELA-/PFA-NonRecur primary tumor, normal cerebellum and cerebrum, but different from the primary tumors Eventually recurred. D Venn diagram representing the number of overlapped and specific hyper/hypoDMCs (from C) between RELA and PFA. E Heatmap showing the top CpGs’ DNA methylation ratios with highest confidence that can potentially predict recurrence from primary tumors of RELA (upper panel) and PFA (lower panel) ependymoma.

