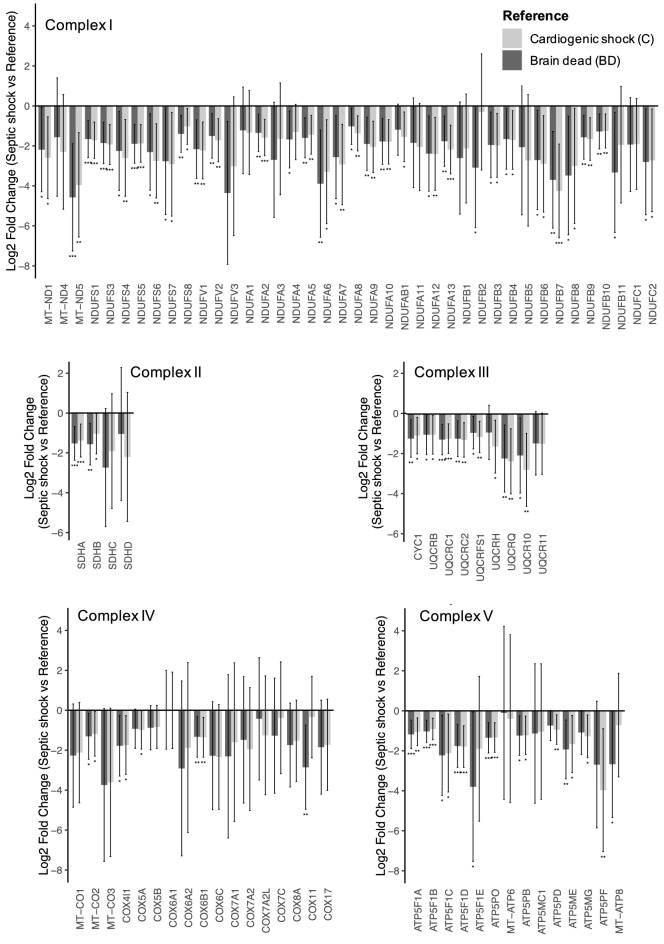
Figure 4.
Mitochondrial complexes were decreased in the S group. The subunits of each mitochondrial complexes are represented. The subunits that were not identified in the proteomic dataset are not shown (Complex I : MT-ND2, MT-ND3, MT-ND6; Complex III : MY-CYB, UQCRHL; Complex IV : COX4l2, COX6B2, COX7B, COX7B2, COX8C, COX10, COX15; Complex V : ATP5MF). The bar represents the mean difference (Log 2 Fold Change) between the S group and the two control groups, the error bar represents the 95% confidence interval. N = 31 patients analyzed for the proteomics (Septic shock n = 12, cardiogenic shock n = 9, brain dead n = 10). *p < 0.05; **p < 0.01; ***p < 0.001 (Tukey’s post-hoc test, Group S versus Reference).

