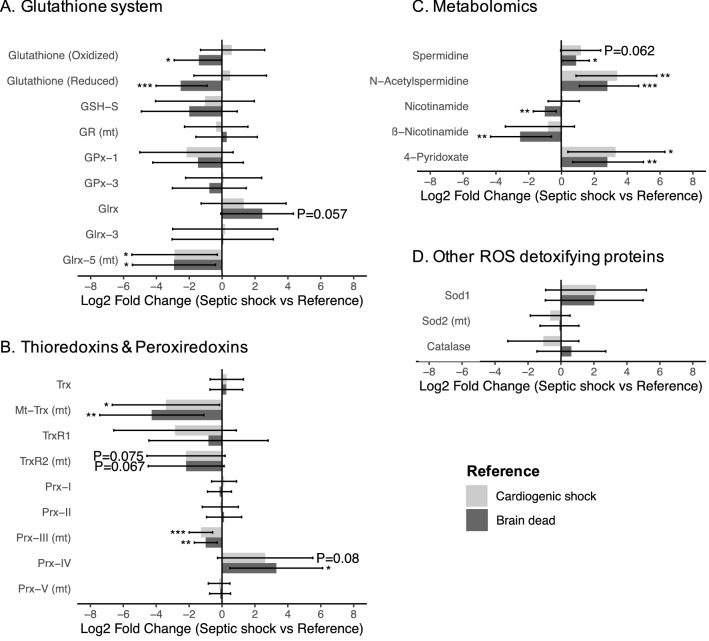
Figure 5.
Alterations of the antioxidant and ROS detoxifying proteins and metabolites. The bar represents the mean difference (Log 2 Fold Change) between the S group and the two control groups, the error bar represents the 95% confidence interval. N = 31 patients analyzed for the proteomics (Septic shock n = 12, cardiogenic shock n = 9, brain dead n = 10) and N = 40 for the metabolomics (Septic shock n = 17, cardiogenic shock n = 6, brain dead n = 17). *p < 0.05; **p < 0.01; ***p < 0.001 (Tukey’s post-hoc test, Group S versus Reference). Glrx, Glutaredoxin; GPx, Glutathione peroxidase; GR, Glutathione disulfide reductase; GSH-S, Glutathione synthetase; Prx, Peroxiredoxin; Sod, Superoxide dismutase; Trx, Thioredoxin; TrxR, Thioredoxin reductase. The mitochondrial location of an enzyme is indicated by (mt).

