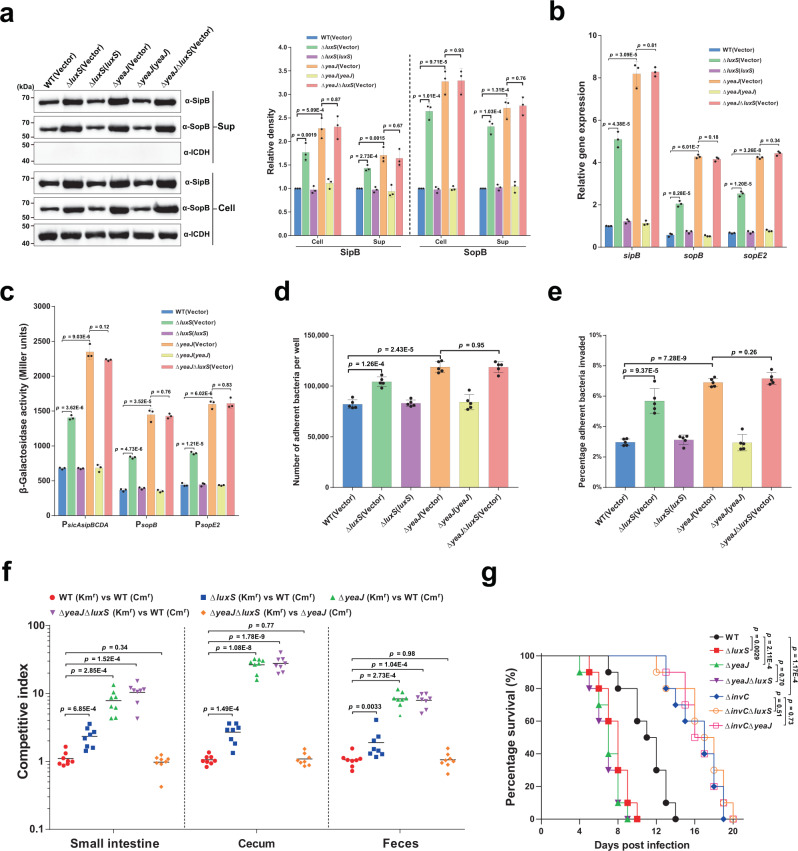
Fig. 3. AI-2 represses the T3SS-1 and negatively regulates the virulence of S. Typhimurium via YeaJ.
a AI-2 negatively regulates intracellular accumulation and secretion of SipB and SopB via YeaJ. Cell pellet (Cell) and concentrated supernatant (Sup) were probed for SipB and SopB by western blot analysis. Isocitrate dehydrogenase (ICDH) was probed as a loading control. The blots shown are representative of three independent experiments with similar results. The band intensities were quantified by scanning densitometry using ImageJ (NIH, USA), normalized to intracellular ICDH, and presented as values relative to that of the wildtype (mean ± s.d.; n = 3 independent experiments). b mRNA levels of T3SS-1 genes were determined by qRT-PCR analyses. Expression was normalized to 16 S rRNA and reported as fold change relative to that of the sipB gene of the wildtype. Data were mean ± s.e.m. of three independent experiments. c The promoter activities of T3SS-1 genes measured using β-galactosidase activity assays (mean ± s.e.m.; n = 3 independent experiments). d, e, Adherence to (d) and invasion of (e) Caco-2 cells by S. Typhimurium strains. Data were mean ± s.e.m. of five independent experiments. f Six-week-old female BALB/c mice were infected orally with a 1:1 mixture of two S. Typhimurium strains carrying kanamycin-resistant (Kmr) pKT100 and chloramphenicol-resistant (Cmr) pBBR1MCS1, respectively. A competitive index (CI) was calculated as the ratio of the test strain carrying pKT100 versus (vs) the control strain carrying pBBR1MCS1 recovered from mice. Horizontal lines represent the geometric mean CI value for each group (n = 8 mice per group). g Deletion of luxS or yeaJ leads to enhanced virulence of S. Typhimurium in mice. Six-week-old female BALB/c mice were infected orally with each S. Typhimurium strain and survival was monitored daily. Data were illustrated as a percentage of mice survival (n = 10 mice per group). Statistical significance was evaluated by two-tailed unpaired Student’s t-test (a–e), two-tailed Mann–Whitney U-test (f), or Log-rank (Mantel–Cox) test (g). P values <0.05 indicate significant differences. Source data are provided as a Source Data file.

