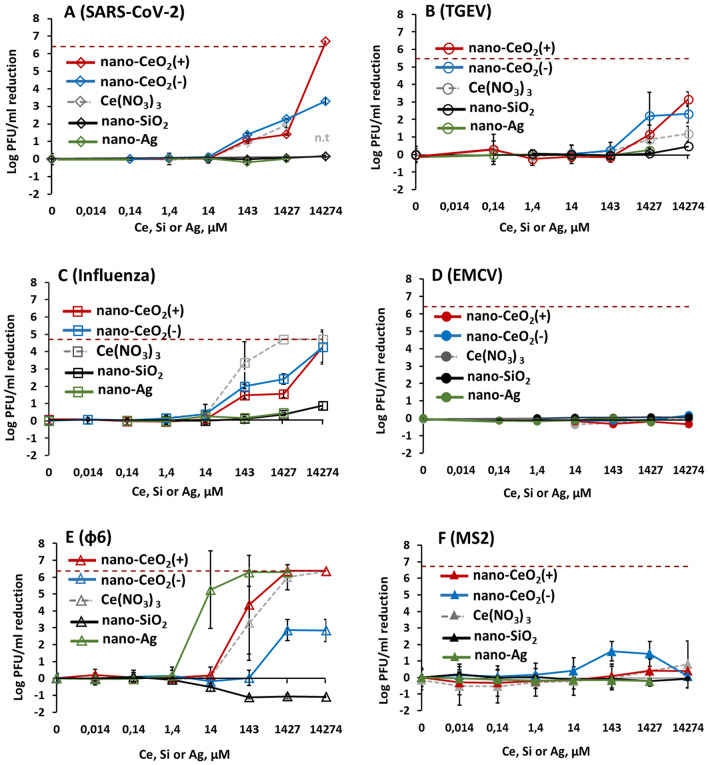
Figure 4.
Antiviral activity of all tested nanoparticles and chemical compounds expressed in µM concentrations to enable comparison. Please note that antiviral activity is expressed as reduction of infectious viral titer, logPFU per ml compared to unexposed control after 1 h. The data of nano-CeO2 are transferred from Fig. 3. (A) coronavirus SARS-CoV-2; (B) transmissible gastroenteritis virus TGEV; (C) influenza virus A/WSN/1933; (D) picornavirus EMCV; (E) bacteriophage ф6; (F) bacteriophage MS2. Closed symbols in (D,F) represent non-enveloped viruses. The results of three independent experiments with standard deviation are shown. Note the logarithmic scale of y-axis. Horizontal dark red dashed line shows the limit of quantification of PFU reduction.

