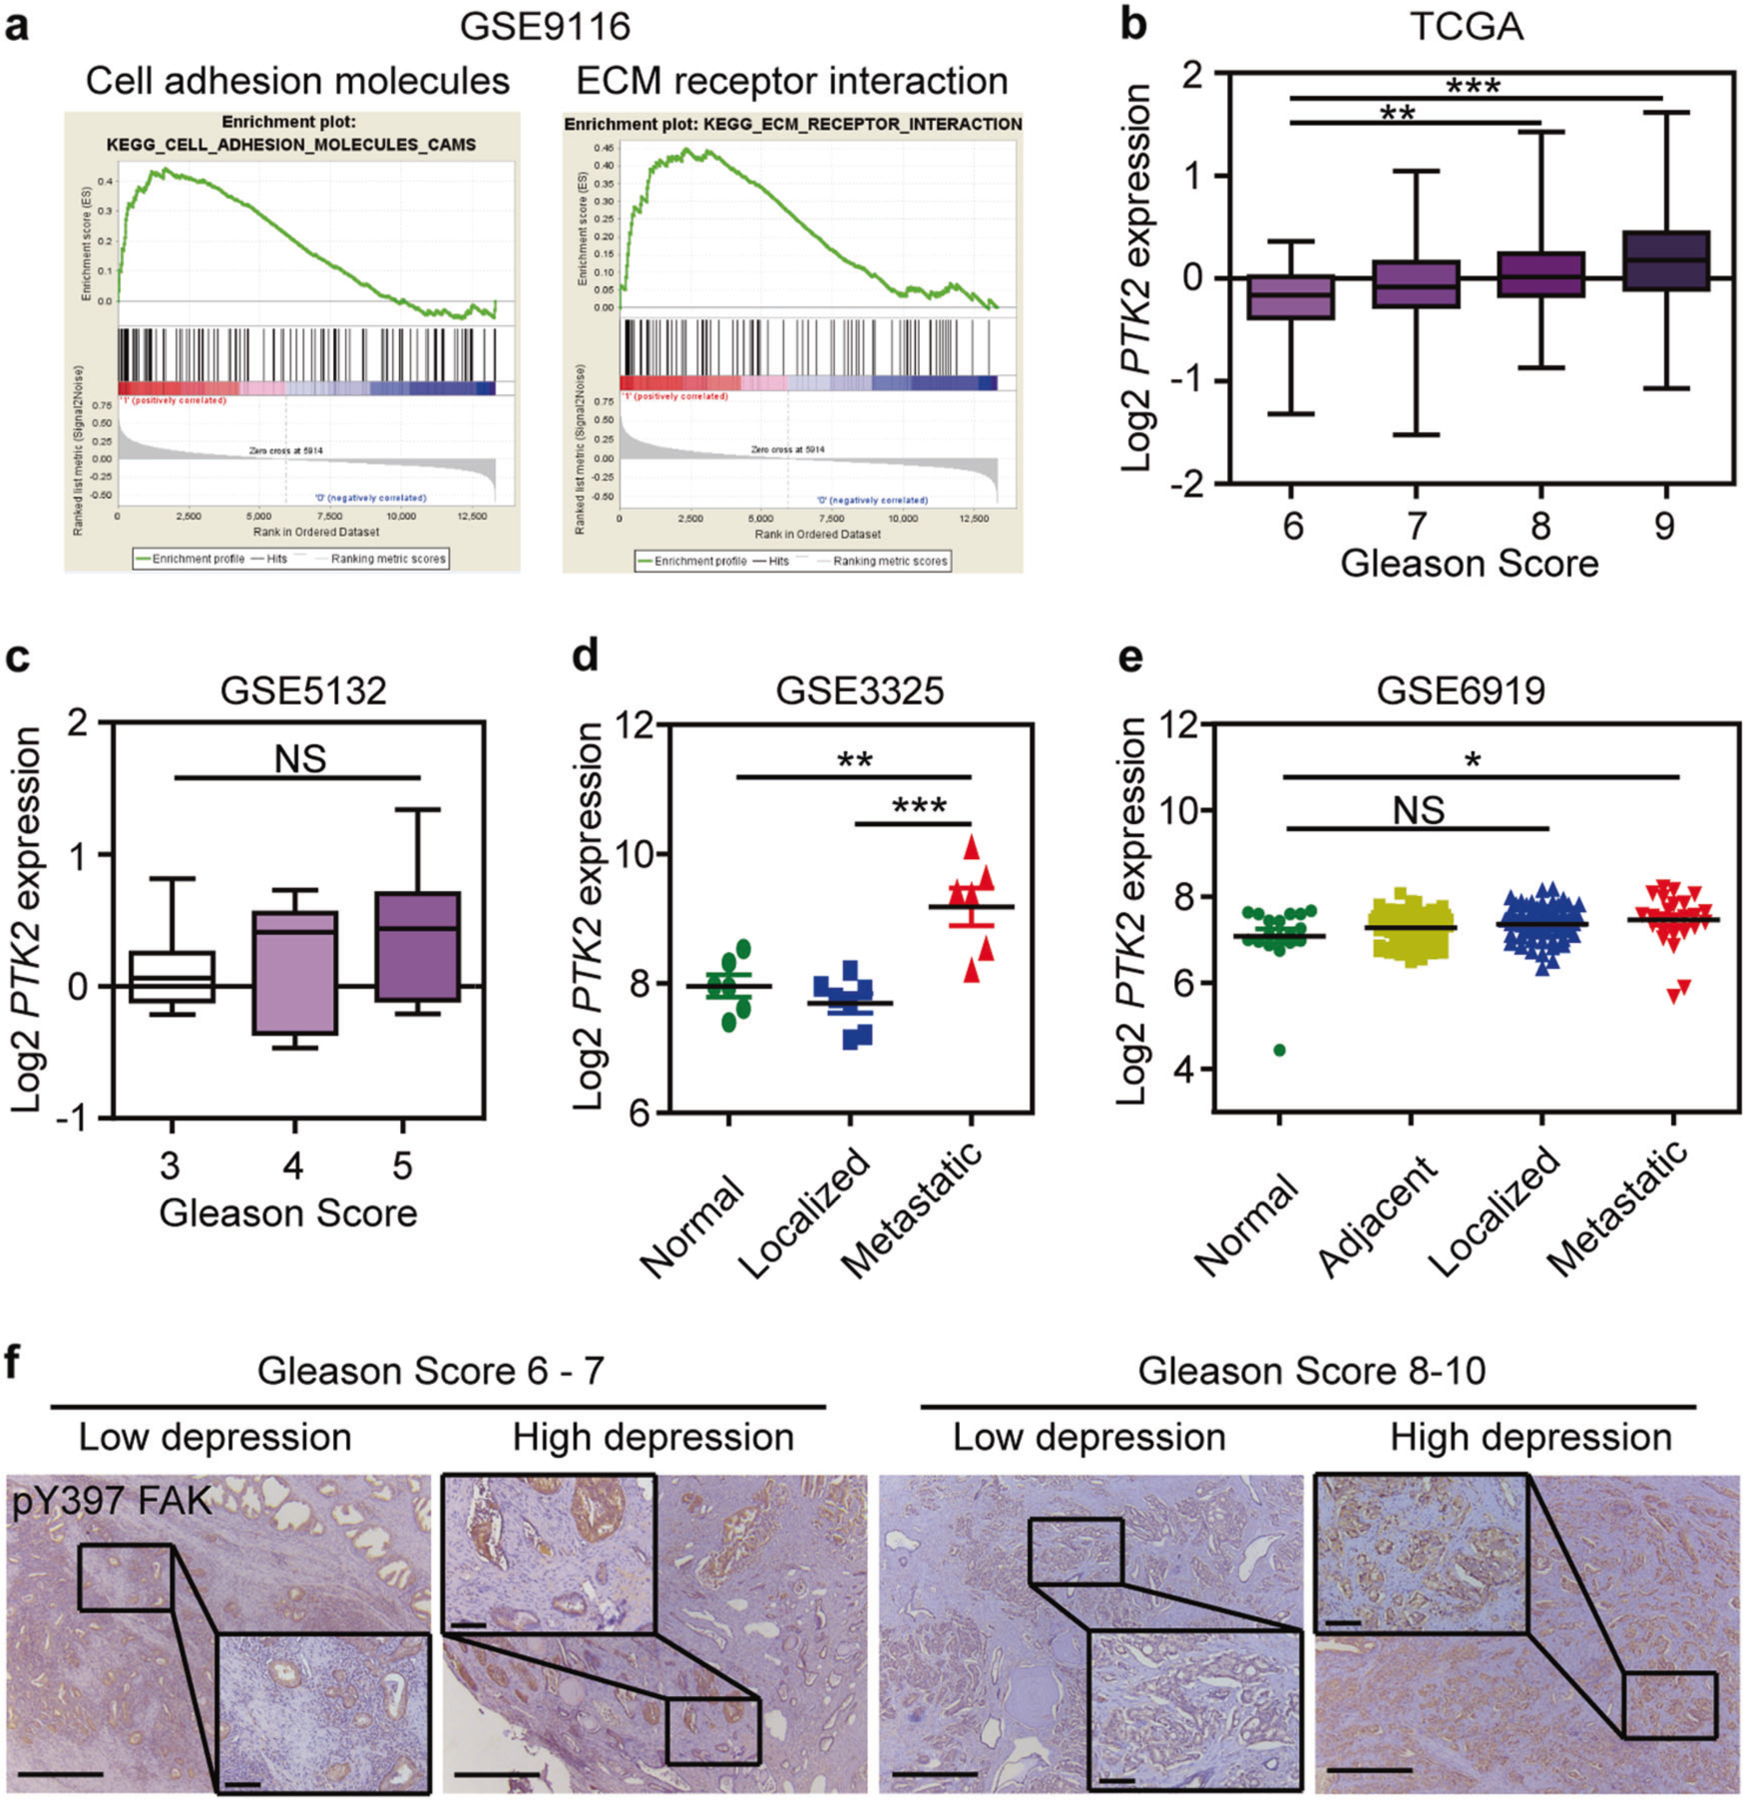
Fig. 1.

FAK is highly expressed and phosphorylated in prostate cancer patients with high degrees of depression and high metastatic features. a Gene set enrichment analysis (GSEA) plot of cell adhesion molecules (NES = 1.78; Nominal P-value = 0.0; FDR q-value = 0.017) and ECM receptor interaction (NES = 1.73; Nominal P-value = 0.0; FDR q-value = 0.028) gene sets in GSE9116. b Relative expression of PTK2 mRNA in prostate cancer patients with high Gleason score in the TCGA prostate cancer database (n = 44 in Gleason score 6 group; n = 237 in Gleason score 7 group; n = 60 in Gleason score 8 group; n = 128 in Gleason score 9 group). c Relative expression of PTK2 mRNA in prostate cancer patients with high Gleason score in GSE5132 database (n = 11 in Gleason score 3 group; n = 12 in Gleason score 4 group; n = 8 in Gleason score 5 group). d Relative expression of PTK2 mRNA in metastatic prostate cancer patients in GSE3325 datasets (n = 6 in Normal group; n = 7 in Localized group; n = 6 in Metastatic group). e Relative expression of PTK2 mRNA in metastatic prostate cancer patients in GSE6919 datasets (n = 18 in Normal group; n = 67 in Adjacent group; n = 61 in Localized group; n = 25 in Metastatic group). f Representative images of FAK phosphorylation in prostate cancer patients with high and low degrees of depression. Bar: 500 µm (low magnification); 100 µm (high magnification). The statistical analysis was based on one-way ANOVA with Tukey’s post-hoc tests (*P < 0.05; **P < 0.01; ***P < 0.001)
