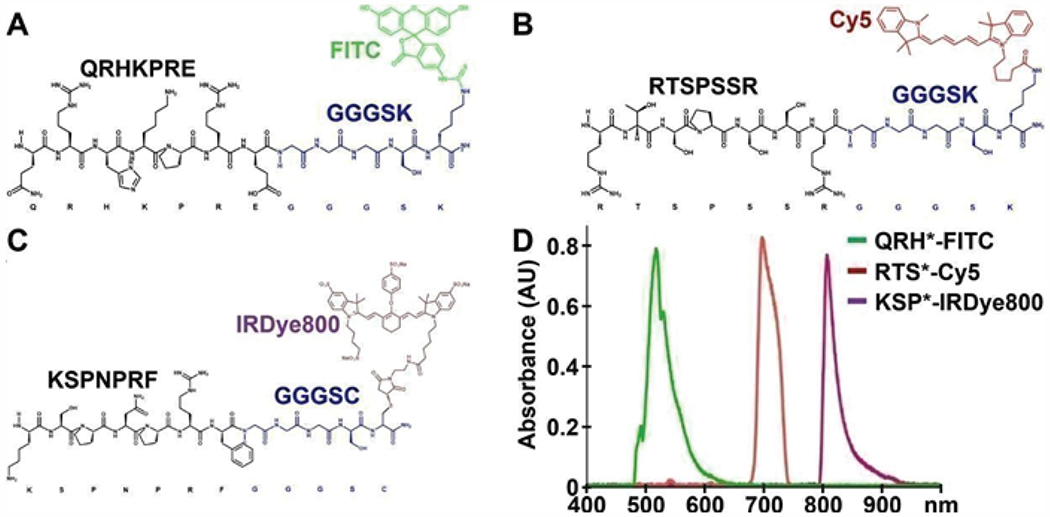
Figure 2: Peptide imaging agents.

Biochemical structures are shown for peptide sequences (black) specific for A) EGFR, B) claudin-1, and C) ErbB2 with linkers (blue) to attach fluorophores FITC, Cy5, and IRDye800, respectively. D) Fluorescence spectra with excitation at λex = 488, 660, and 785 nm resulted in emission with peaks at λem = 519, 699, and 808 nm, respectively, and showed minimal overlap.
