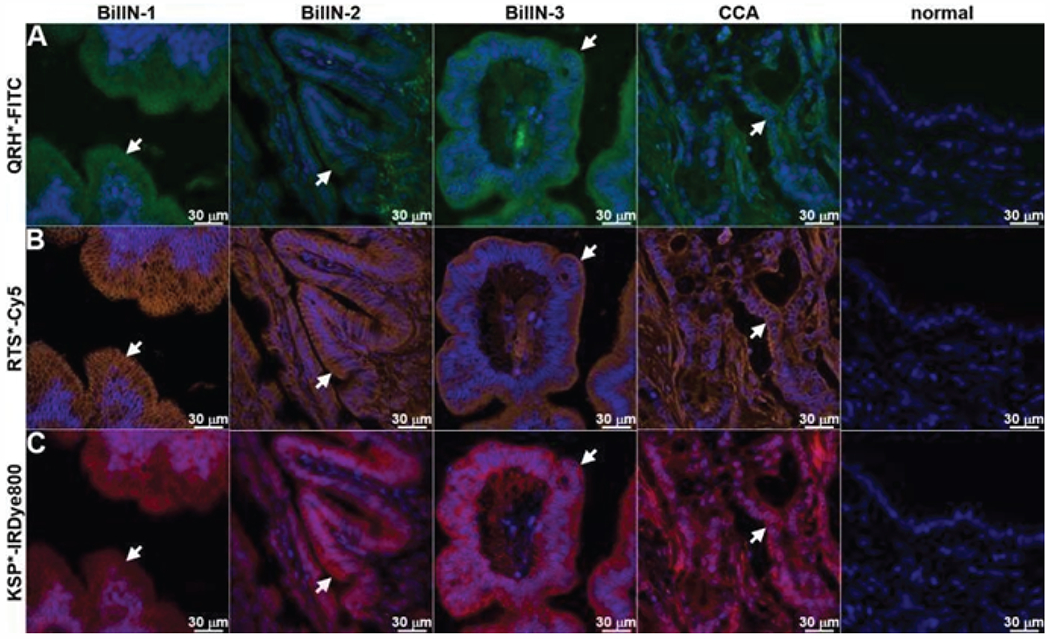
Figure 3: Immunofluorescence.

Using QRH*-FITC, RTS*-Cy5, and KSP*-IRDye800, bright signal is seen at the cell surface (arrows) for BilIN-1, -2, -3, and cholangiocarcinoma (CCA) while minimal intensity is seen in the stroma. By comparison, minimal signal is seen in normal biliary duct epithelium.
