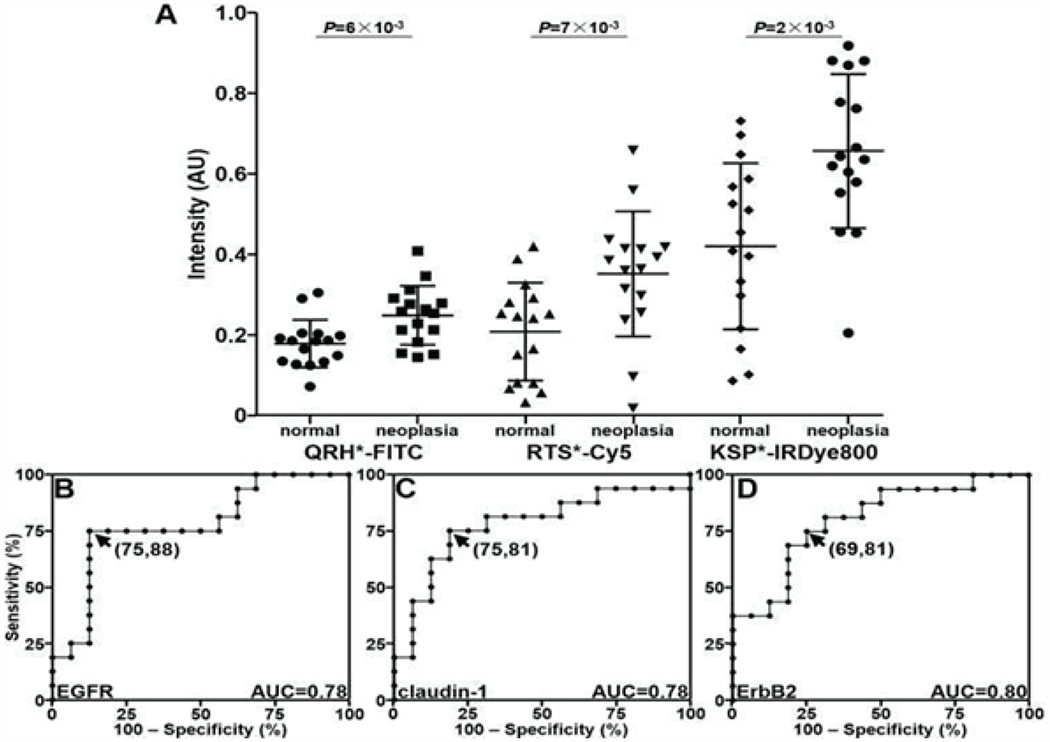
Figure 4: Quantified fluorescence intensities.

A) Scatter plot shows individual values for specimens of biliary neoplasia, including BilIN-1, BilIN-2, BilIN-3, and CCA, compared with that for normal epithelium. Differences in mean results are significant for QRH*-FITC (EGFR), RTS*-Cy5 (claudin-1), and KSP*-IRDye800 (ErbB2) with P = 6×10⁻³, 7×10⁻³, and 2×10⁻³ by unpaired t-test, respectively. ROC curves show optimal sensitivity and specificity of B) 75% and 88% for EGFR, C) 75% and 81% for claudin-1, and D) 69% and 81% for ErbB2 with AUC of 0.78, 0.78, and 0.80, respectively.
