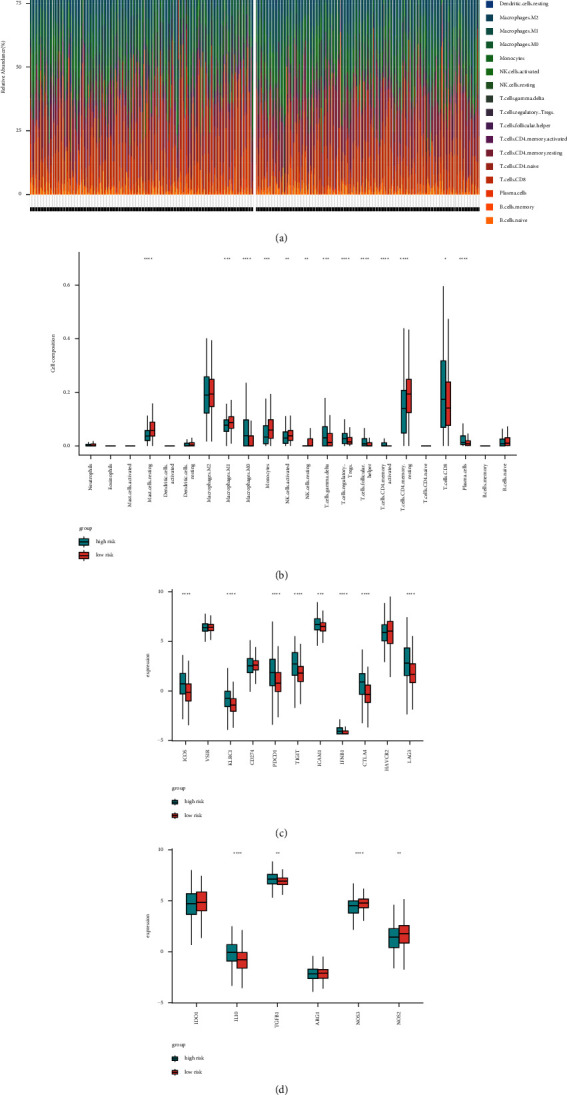
Figure 6.

Immune landscapes between high-and low-risk score patients. (a) The abundance of immune infiltration in high-and low-risk score patients from TCGA cohort. (b) The proportions of different immune cells between high-and low-risk score groups in the TCGA cohort. (c)–(d) The proportions of immunomodulators and immunosuppressive cytokines between high-and low-risk score groups in the TCGA cohort. (∗: P ≤ 0.05; ∗∗: P ≤ 0.01; ∗∗∗: P ≤ 0.001; ∗∗∗∗: P ≤ 0.0001).
