Figure 7.

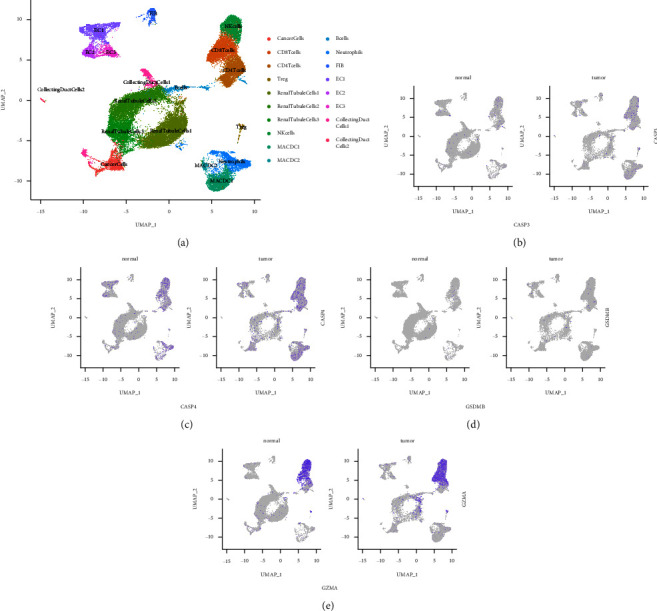
Pyroptosis-related genes observed at a single-cell level. (a) UMAP clustering of cells by differentially expressed markers. (b)–(e) Feature plots of CASP3, CASP4, GSDMB, and GZMA. UMAP, uniform manifold approximation, and projection.

Pyroptosis-related genes observed at a single-cell level. (a) UMAP clustering of cells by differentially expressed markers. (b)–(e) Feature plots of CASP3, CASP4, GSDMB, and GZMA. UMAP, uniform manifold approximation, and projection.