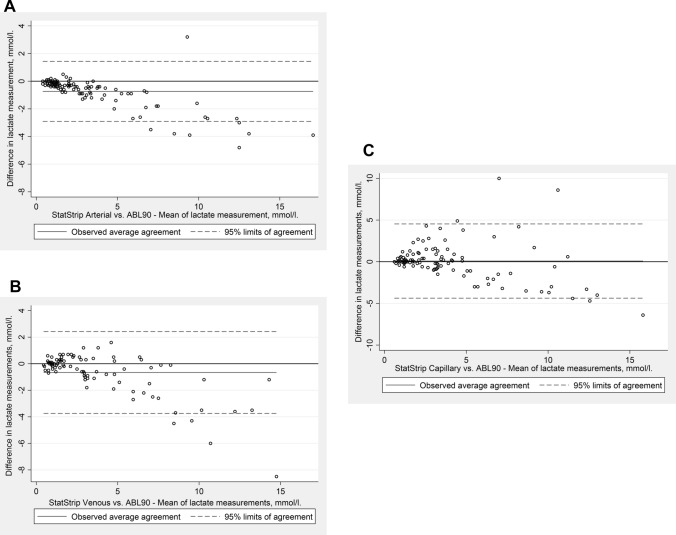
Fig. 3.
a Bland–Altman plot of blood lactate levels in arterial samples measured by StatStrip Xpress compared to measurements made by ABL90 in the same arterial samples. b Bland–Altman plot of blood lactate levels in venous samples measured by StatStrip Xpress compared to measurements made by ABL90 in arterial samples. c Bland–Altman plot of blood lactate levels in capillary samples measured by StatStrip Xpress compared to measurements made by ABL90 in arterial samples

