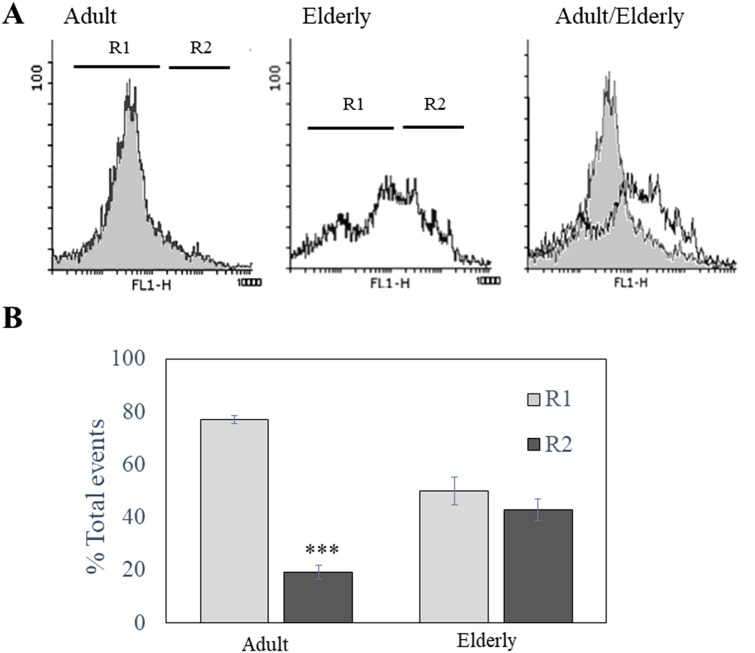
Fig. 4.
Flow cytometric analysis of NETs DNA size. A Representative fluorescence histograms relative to DNA presents in NETS obtained from adult and elderly subjects. DNA was staining with SYBR Green dye (10 μg/ml) and green fluorescence obtained was displayed in a logarithmic scale. Region R1 was created to include the majority (more than 70%) of fluorescence obtained in adult samples; in samples from elderly subjects, DNA showed a different fluorescence distribution with a population showing higher fluorescence and, therefore, higher size (collected in Region R2) compared to adult samples. To stress the shift in DNA size during the aging, an overlapped histogram was added (adult/elderly). B Quantification of fluorescence events distribution between R1 and R2 in adult and elderly groups expressed as % of total events. ***p < 0.001 referred to R1

