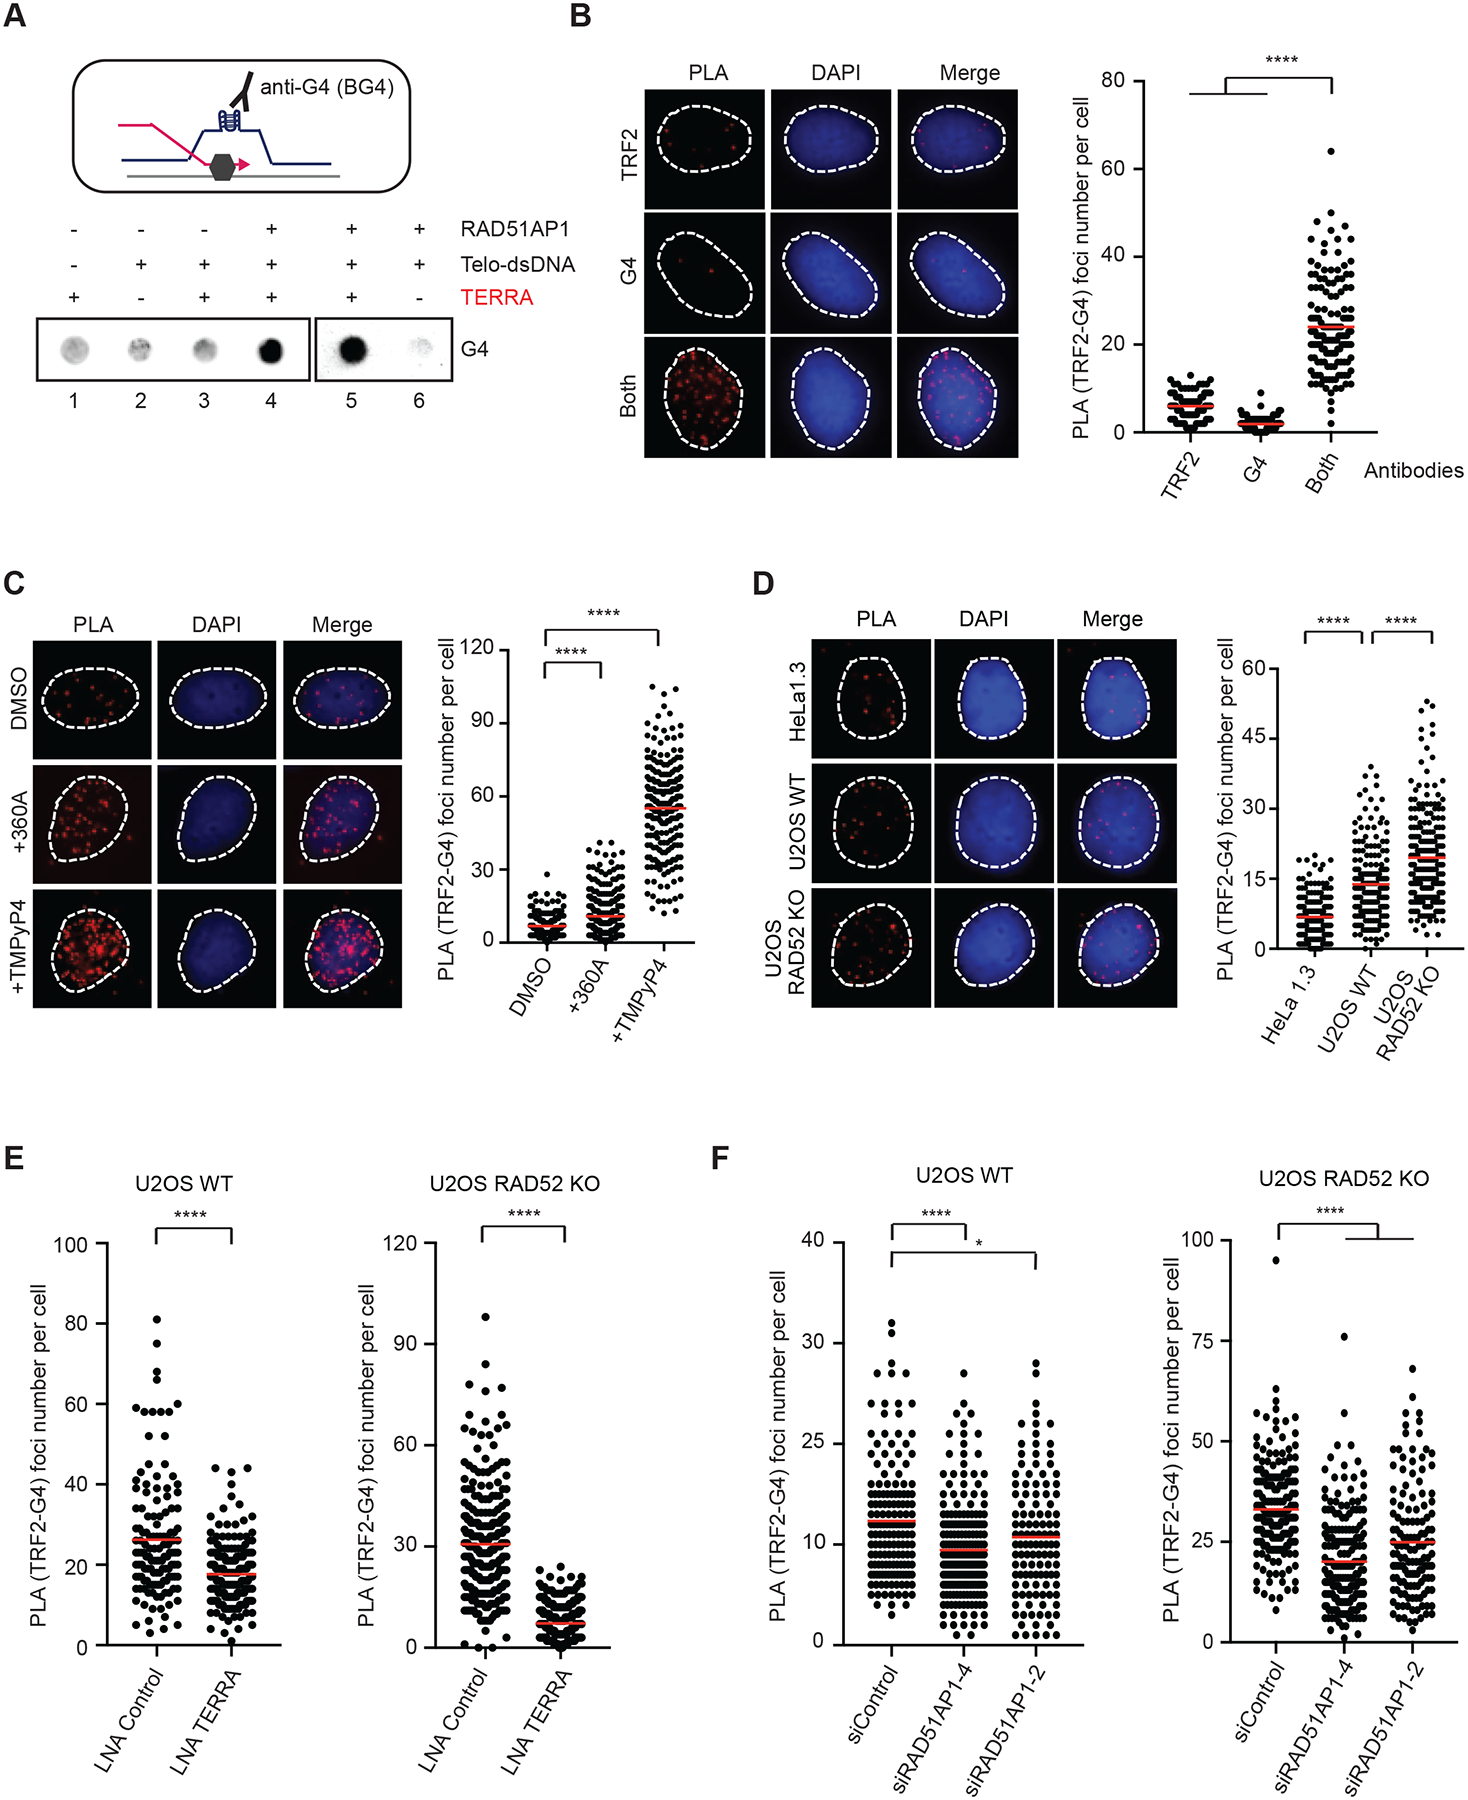
Figure 4. Telomeric R-loops increases G4s.

(A) A schematic of G4 formation at an R-loop (upper panel). Telomeric R-loops were generated by incubating TERRA (60-nt, 60 nM), RAD51AP1 (0.5 μM) and dsDNA containing telomeric sequences for 20 min. Reaction products were analyzed for G4s by dot blot using the BG4 antibody. (B) Detection of telomeric G4s by PLA. U2OS cells were analyzed by PLA using anti-G4 (1H6) and anti-TRF2 antibodies, either alone or in combination. Representative images of PLA foci are shown (left) and quantified in individual cells (right) (n>140). Red lines: mean values. ****: P value <0.0001. (C) U2OS cells were treated with 360A (10 μM) or TMPYP4 (4 μM) for 6 hr, and telomeric G4s were analyzed as in (B) (n>220). Red lines: mean values. ****: P value <0.0001. (D) HeLa1.3, U2OS WT and U2OS RAD52 KO cells were analyzed as in (B) (n>190). Red lines: mean values. ****: P value <0.0001. (E) U2OS WT and RAD52 KO cells transfected with Control or TERRA LNA were analyzed as in (B) (n>240). Red lines: mean values. ****: P value <0.0001. (F) U2OS WT and RAD52 KO cells transfected with siControl or two different siRAD51AP1 were analyzed as in (B) (n>130). Red lines: mean values. ****: P value <0.0001, *: P value 0.03. To specifically detect G4s in DNA, all PLA experiments were performed with cells treated with RNaseA (10 μg/ml) at 37 °C for 1 hr.
