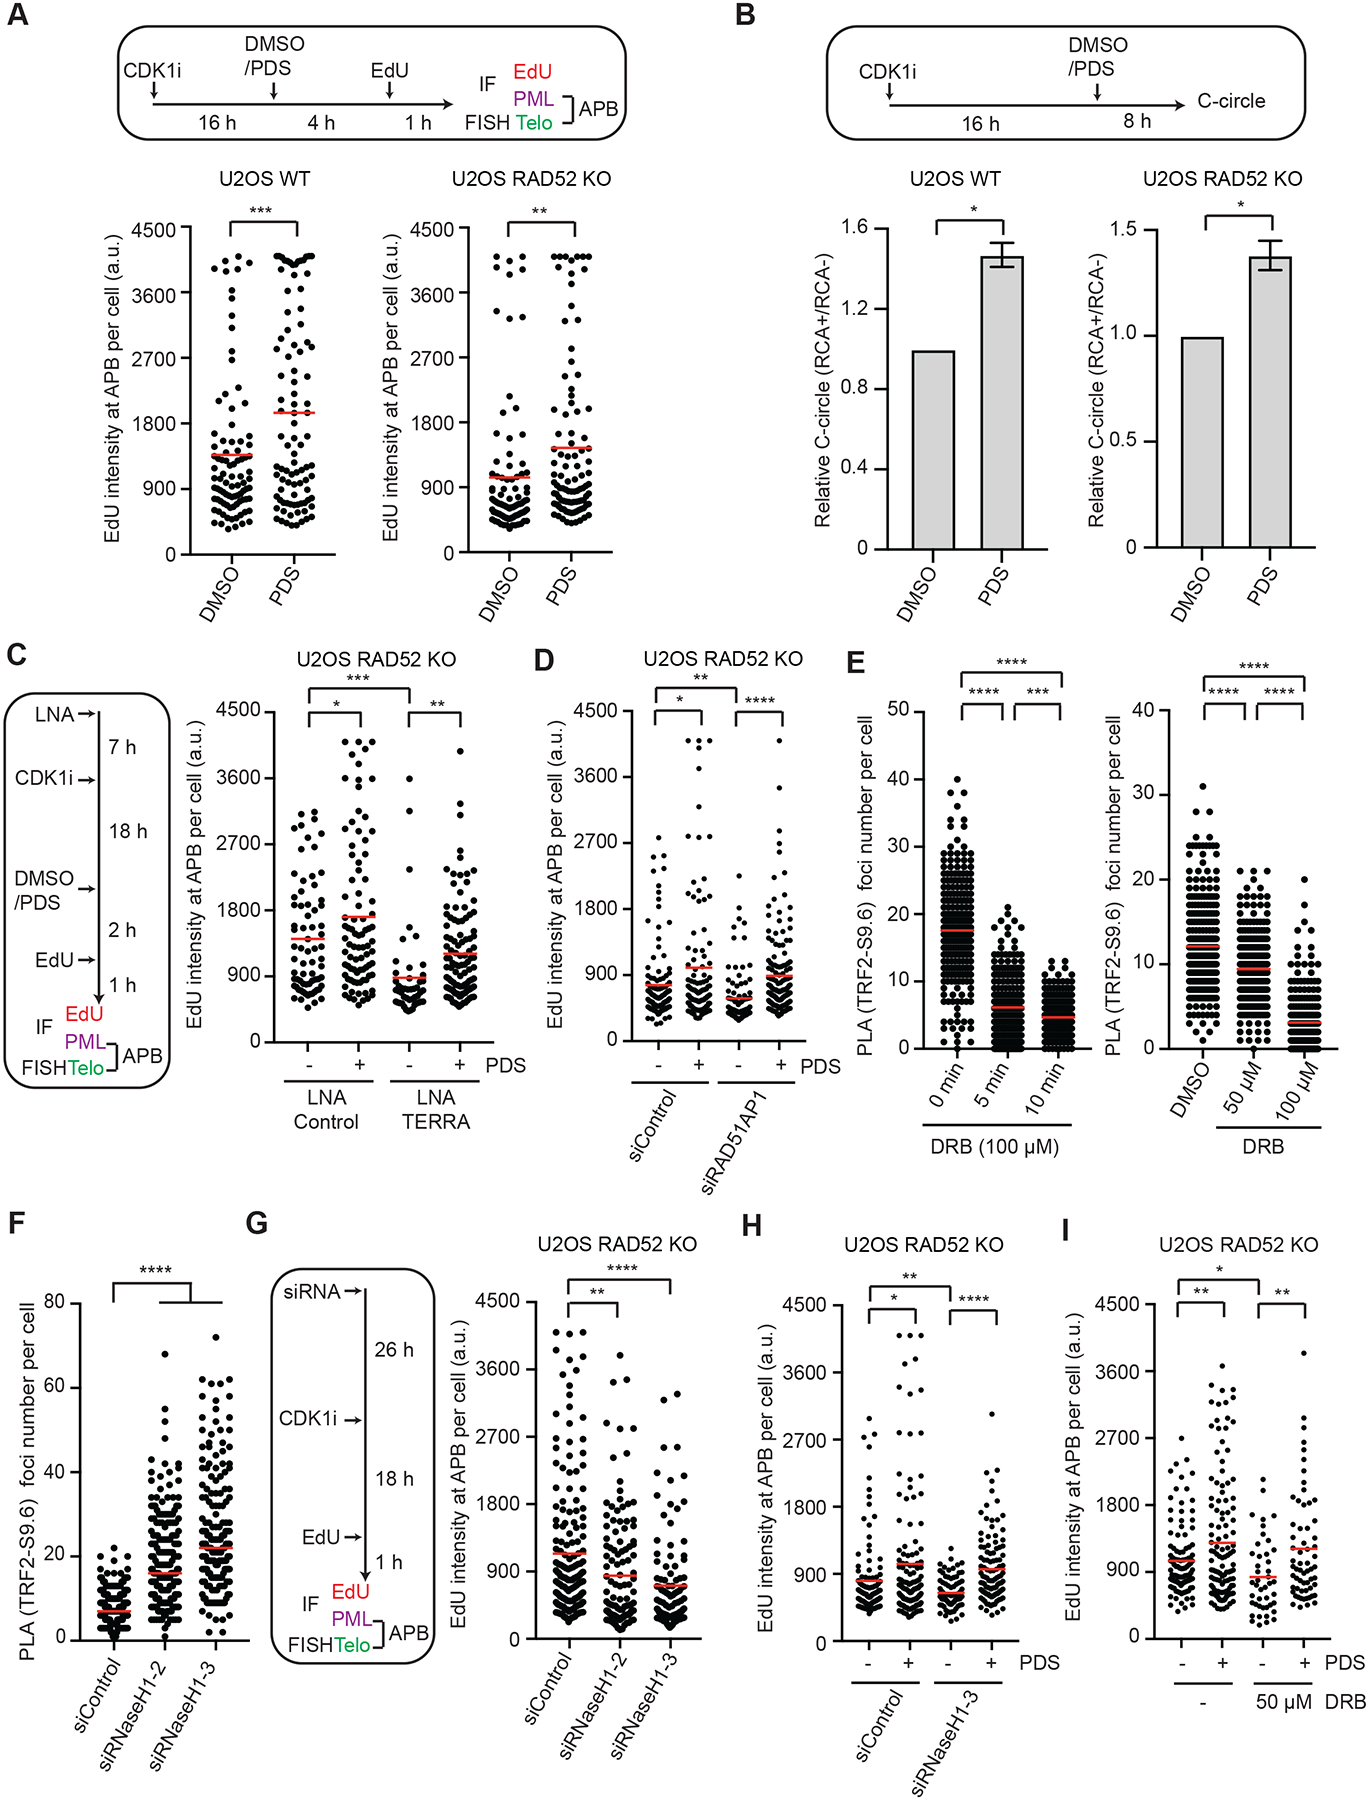
Figure 5. G4s act downstream of transient R-loops to promote ALT.

(A) U2OS WT and RAD52 KO cells were synchronized in G2, treated with DMSO or 2.5 μM PDS, and analyzed for EdU intensity at APBs. The EdU signals at APBs were quantified in individual cells (n>200) and normalized by nuclear areas. Red lines: mean intensities. ***: P value 0.0001, **: P value 0.008. (B) U2OS WT and RAD52 KO cells were treated with 5 μM PDS and analyzed by the C-circle assay. The RCA+/RCA-ratios of samples reflect the relative levels of C-circle amplification. Error bars: SEM, n=3 (experimental triplicates); P values 0.01 (left panel) and 0.03 (right panel). (C) U2OS RAD52 KO cells transfected with Control or TERRA LNA were synchronized in G2 and then treated with DMSO or 2.5 μM PDS as indicated. The EdU signals at APBs were quantified in individual cells (n>230) and normalized by nuclear areas. Red lines: mean intensities. *: P value 0.02, **: P value 0.004, ***: P value 0.0001. (D) U2OS RAD52 KO cells transfected with siControl or siRAD51AP1 were synchronized in G2 and then treated with DMSO or 3 μM PDS for 3 hrs. The EdU signals at APBs were quantified in individual cells (n>100) and normalized by nuclear areas. Red lines: mean intensities. *: P value 0.015, **: P value 0.005, ****: P value <0.0001. (E) U2OS RAD52 KO cells were treated with 100 μM DRB for 0, 5, and 10 min (left), or with 0, 50, and 100 μM DRB for 30 min (right). Telomeric DNA:RNA hybrids were quantified by PLA using S9.6 and TRF2 antibodies. PLA foci were quantified in individual cells (n>220). Red lines: means. ***: P value 0.0001, ****: P value <0.0001. (F) U2OS RAD52 KO cells treated with Control or RNaseH1 siRNA were analyzed for telomeric DNA:RNA hybrids by PLA using S9.6 and TRF2 antibodies. PLA foci were quantified in individual cells (n>170). Red lines: means. ****: P value <0.0001. (G) U2OS RAD52 KO cells treated with Control or RNaseH1 siRNA were synchronized in G2 and analyzed for EdU intensity at APBs. The EdU signals at APBs were quantified in individual cells (n≥150) and normalized by nuclear areas. Red lines: mean intensities. **: P value 0.003, ****: P value <0.0001. (H) U2OS RAD52 KO cells transfected with siControl or siRNaseH1 were synchronized in G2 and then treated with DMSO or 3 μM PDS for 3 hrs. The EdU signals at APBs were quantified in individual cells (n>130) and normalized by nuclear areas. Red lines: mean intensities. *: P value 0.019, **: P value 0.007, ****: P value <0.0001. (I) U2OS RAD52 KO cells were synchronized in G2 and then treated with DMSO, 3 μM PDS, and 50 μM DRB for 3 hr. The EdU signals at APBs were quantified in individual cells (n>125) and normalized by nuclear areas. Red lines: mean intensities. *: P value 0.011, **: P value 0.003.
