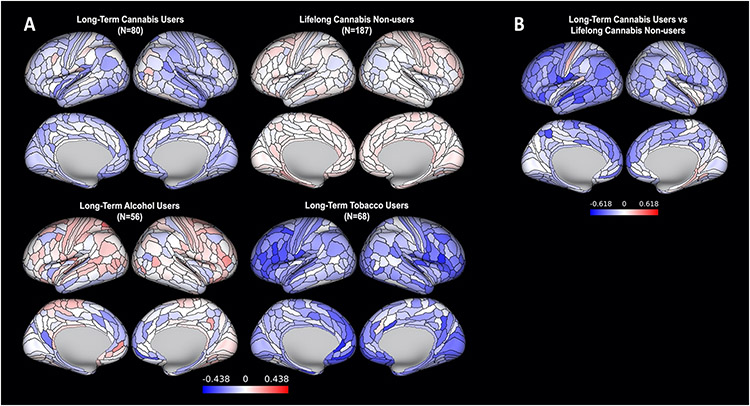
Figure 2.
A comparison of long-term cannabis users and three comparison groups on regional cortical thickness. (A) Means for each group, adjusted for sex and standardized on the full sample (M=0, SD=1; blue regions are thinner than average and red regions are thicker than average). (B) Differences between long-term cannabis users and lifelong cannabis non-users (34 regions were significant at pFDR < .05, corrected across 360 regions). No other group comparisons revealed significant differences in regional cortical thickness. To allow for a comprehensive examination of effect sizes, maps have not been thresholded by significance.

