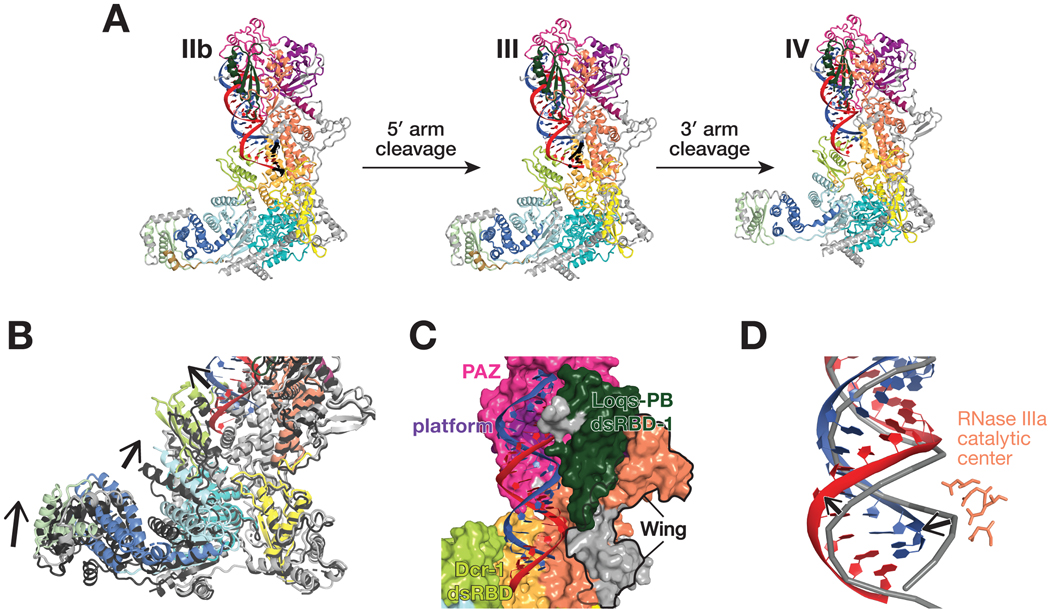
Figure 6. Conformational transitions define ordered product release.
(A) Overall views of the pre-miRNA-bound Dcr-1•Loqs-PB complex in presence of Mg2+ before cleavage (structure IIb), after cleavage of the 5′ arm of the model pre-miRNA (structure III) and after cleavage of both the 5′ and 3′ arms (structure IV).
(B) Close-up view showing differences in the positions of the Dcr-1 dsRBD and Hel2i domains and the Loqs-PB dsRBD-3 in the Dcr-1•Loqs-PB•pre-miRNA structure IV after both 5′ and 3′ arms of the pre-miRNA have been cleaved (red and blue) relative to those in structure III after cleavage of the 5′ arm of the model pre-miRNA (protein domains in dark gray). Structural alignments were performed by superposition of Dcr-1•Loqs-PB•pre-miRNA complexes. Black arrows indicate conformational changes upon the second cleavage event.
(C) Structure of Dcr-1•Loqs-PB•pre-miRNA complex in surface (protein) and cartoon (RNA) views, showing the mature miRNA/miRNA* duplex remaining anchored to the Dcr-1 PAZ and platform domains.
(D) Superposition of atomic models of mature duplex (structure IV) and pre-miRNA (structure IIb), showing the lower part of the duplex (red and blue) shifted ~5 Å from its position before cleavage (gray). RNA shown in cartoon representation. RNase IIIa catalytic center (structure IV) shown as sticks.

