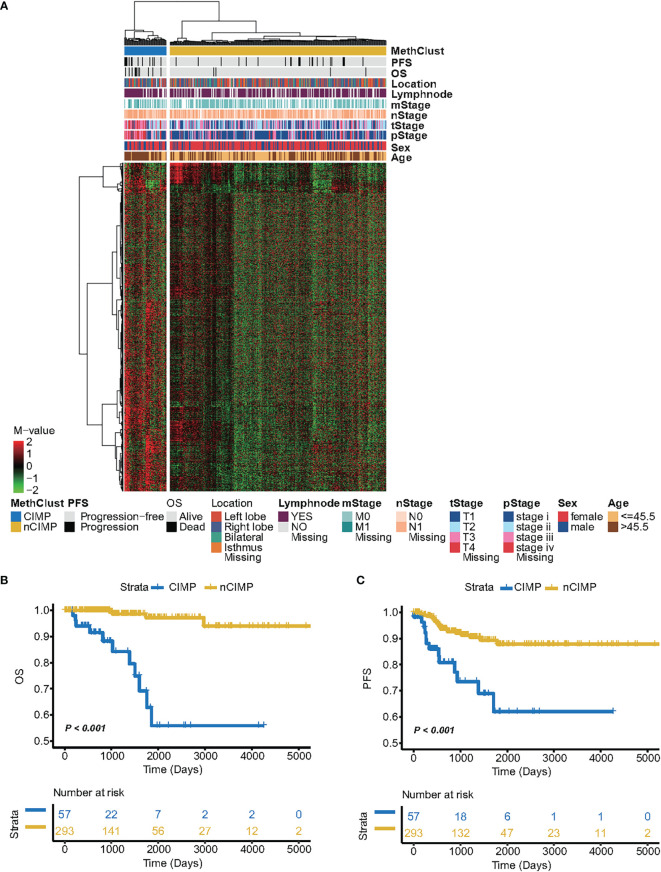
Figure 1.
Identification of CIMP and its association with clinical outcome. (A) Heatmap showing the DNA methylation pattern between CIMP (high-methylation) and nCIMP(low-methylation) using DNA methylation M-values. Kaplan-Meier curves between two epigenetic phenotypes regarding (B) OS (Overall survival) and (C) PFS (Progression free survival).

