Figure 2.
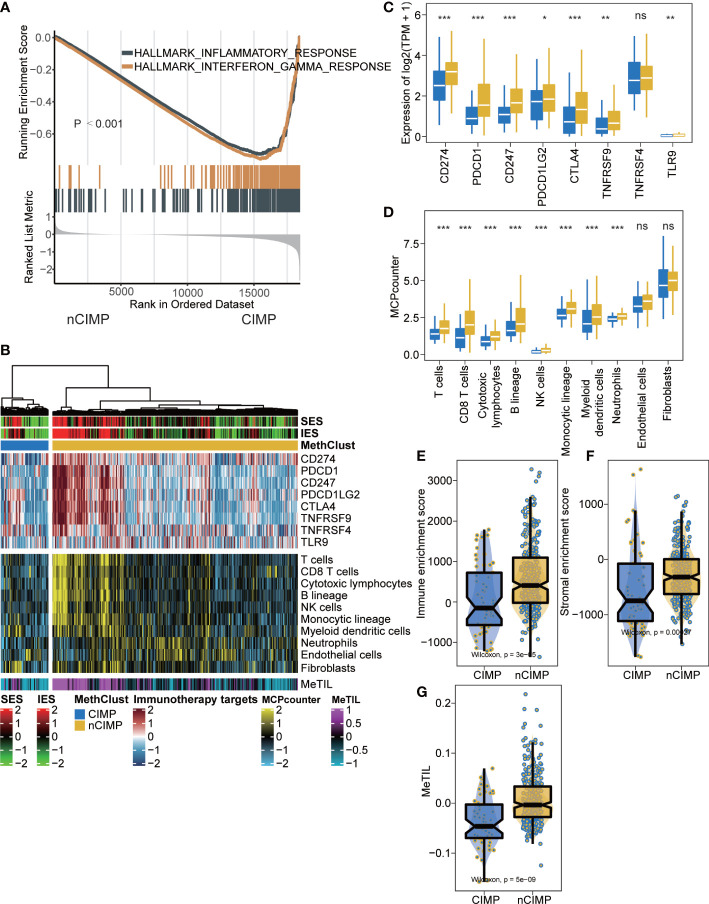
Tumor microenvironment landscape of CIMP. (A) GSEA plot showing inactivation of inflammatory response and interferon-γ. (B) Heatmap showing the immune profile in the TCGA-PTC cohort, with the top panel showing the expression of genes involved in immune checkpoint targets, the middle panel showing the enrichment level of 10 microenvironment cell types, and the bottom panel showing the DNA methylation of tumor-infiltrating lymphocytes (MeTILs). The immune enrichment score and stromal enrichment score were annotated at the top of the heatmap. (C) Boxplot showing the distribution of expression of immune checkpoint target genes between two epigenetic phenotypes. (D) Boxplot showing the distribution of enrichment score of 10 microenvironment cell types between two epigenetic phenotypes. Distribution of immune enrichment scores, stromal enrichment scores and MeTIL scores between two epigenetic phenotypes were shown in (E–G), respectively (ns stands for no significance, *p < 0.05, **p < 0.01, ***p < 0.001).

