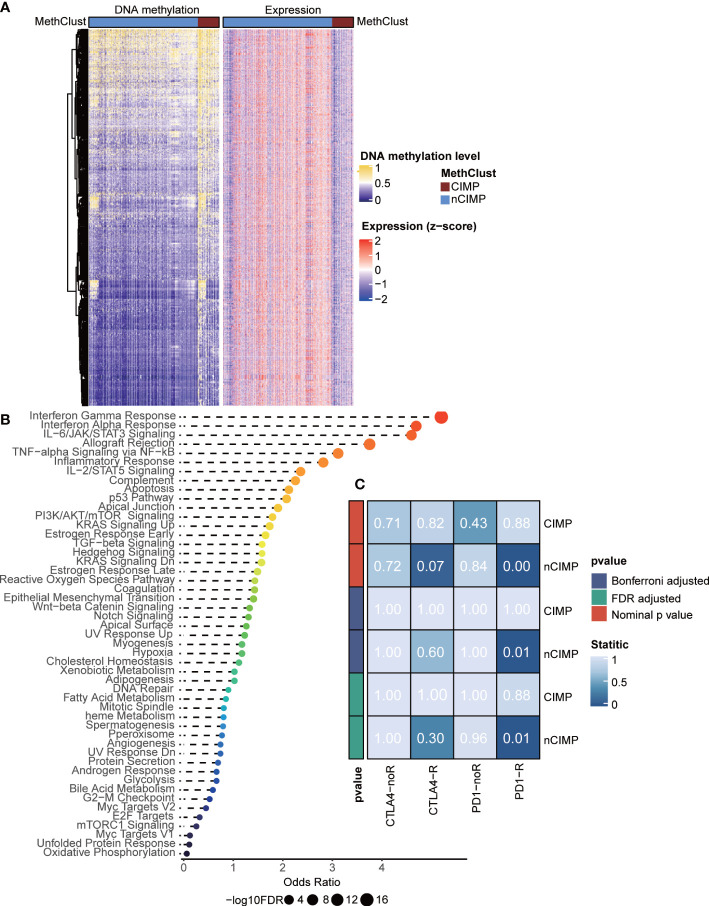
Figure 3.
Integrated analysis of DNA methylation and transcriptome gene expression, and prediction of sensitivity of methylation phenotypes to immune checkpoint therapy. (A) Heatmap showing the association between DNA methylation and gene expression, presenting with an epigenetic silencing pattern. (B) Dotplot showing the Enrichr functional enrichment of 1,467 adjacent genes. (C) Heatmap of subclass analysis result showing the differences of sensitivity to several immune checkpoint inhibitors between the CIMP and nCIMP groups.

