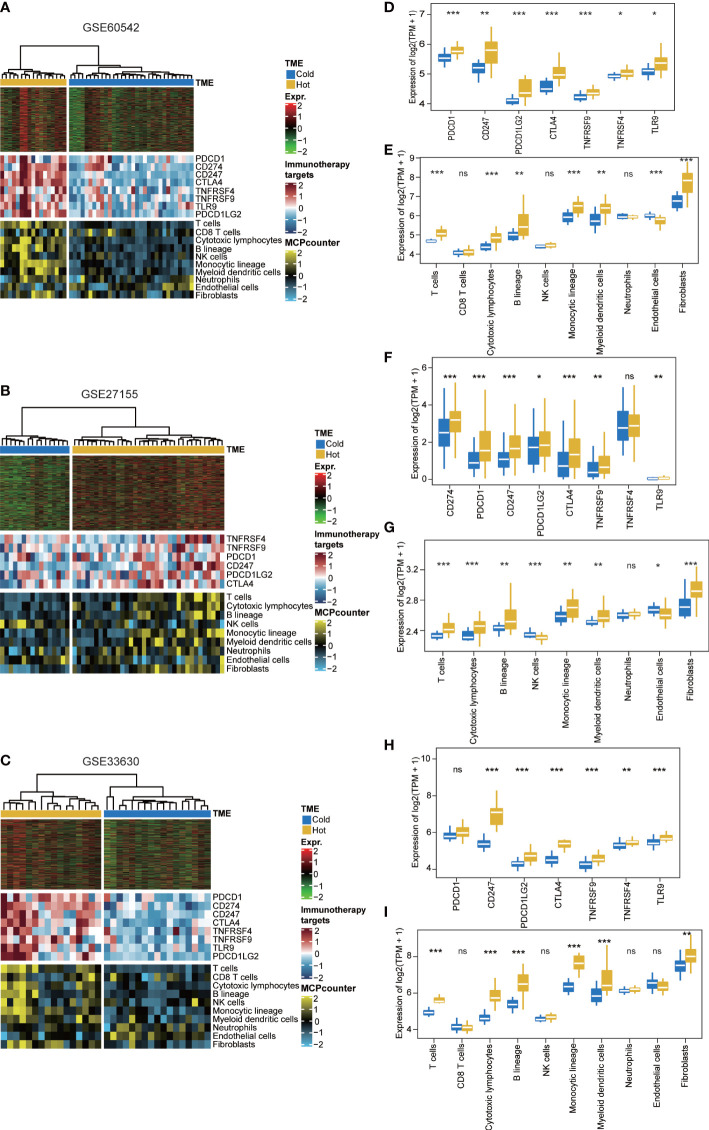
Figure 4.
Validation of TME using supervised clustering based on 1,467 epigenetically silenced genes. The heat map showed the expression of these genes (top panel), genes representing immune checkpoint targets (middle panel), and immune and stromal cells (bottom panel) in three validation cohorts, including (A) GSE60542, (B) GSE27155, and (C) GSE33630. (D, F, H) Expression level (normalized transcripts per million) of different immune checkpoint genes in different methylation phenotypes of three validation cohorts. (E, G, I) The boxplot showed the accumulation of immune and stromal cell populations distinguished by different methylation phenotypes in the three validation cohorts. The difference was verified statistically through the Kruskal–Wallis test, and the p-values are noted with asterisks at the top of each boxplot (ns stands for no significance, *p < 0.05, **p < 0.01, ***p < 0.001).

