Figure 6.

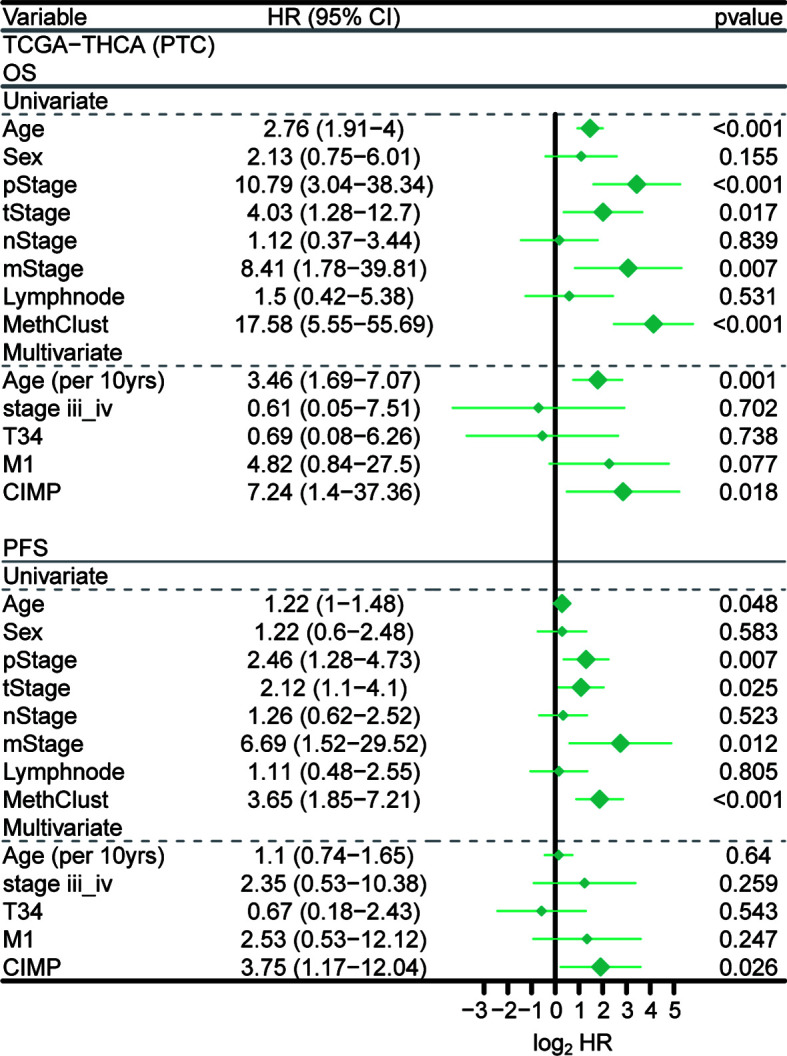
Independent prognostic value of CIMP. Forest plot showing the hazard ratio (95% CI) in univariate and multivariate Cox regressions with the corresponding P values.

Independent prognostic value of CIMP. Forest plot showing the hazard ratio (95% CI) in univariate and multivariate Cox regressions with the corresponding P values.