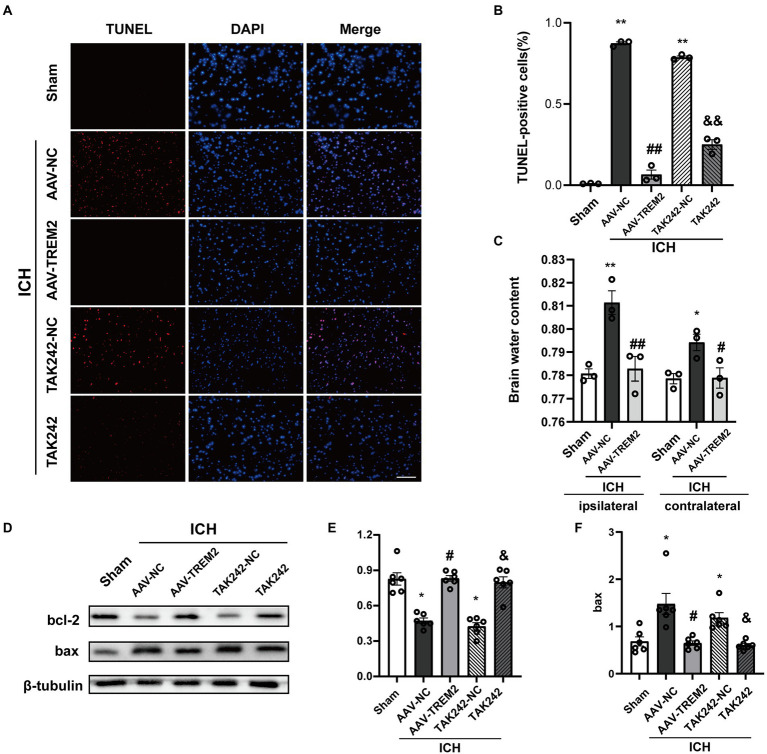
Figure 5.
TUNEL staining and brain water content following intracerebral hemorrhage. (A,B) TUNEL staining of brain tissue (DAPI: blue, TUNEL: red), and quantitative analysis of TUNEL staining. **p < 0.01, vs. the sham group, ##p < 0.01, vs. the AAV-NC + ICH group, &&p < 0.01, vs. the TAK242-NC + ICH group. (C) Brain water content both in ipsilateral and contralateral hemisphere. **p < 0.01, vs. corresponding sham group, #p < 0.05, ##p < 0.01, vs. the corresponding AAV-NC + ICH group. (D–F) Expression levels of bcl2 and bax in different treated groups, *p < 0.05, vs. the sham group, #p < 0.05, vs. the AAV-NC + ICH group, &p < 0.05, vs. the TAK242-NC + ICH group. ICH: intracerebral hemorrhage, AAV, Adeno-associated virus; LV, lentivirus; NC, negative controls. Scale bar: 100 μm. The data were represented as mean ± SEM. n = 3 per group.

