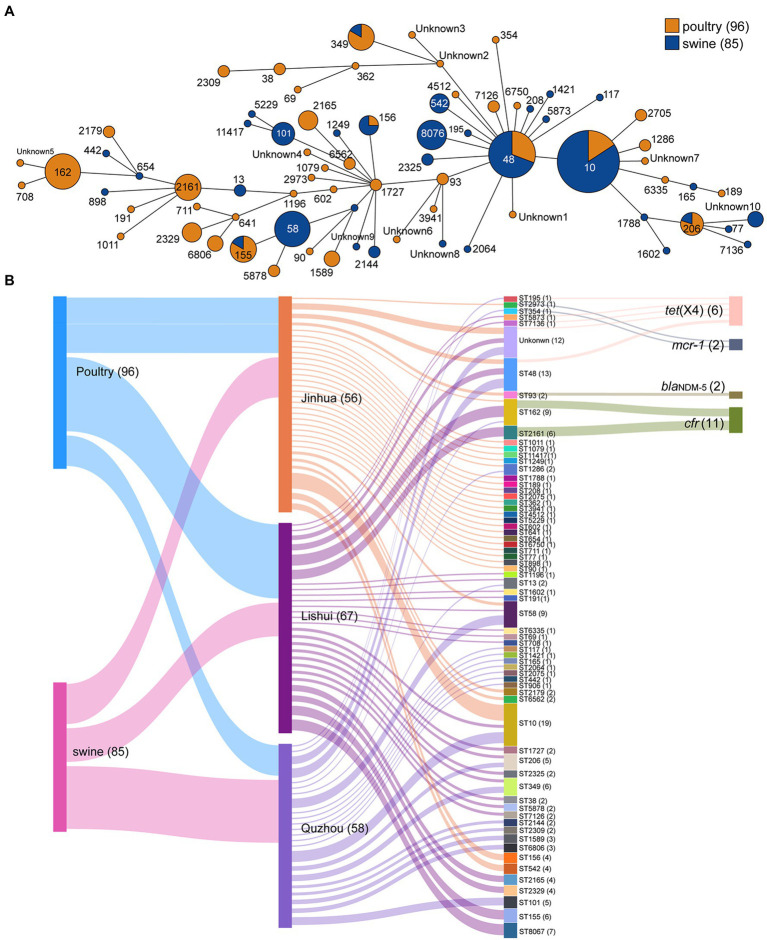
Figure 3.
Minimum spanning tree of E. coli strains based on MLST and Sankey diagram combining the provinces, STs, farms, and sampling sources based on 181 E. coli isolates. (A) Each node represents a single ST. The size of the nodes is proportional to the number of isolates. The length of branches between each node is proportional to the number of different alleles that differ between two linked nodes; (B) the diameter of the line is directly proportional to the number of isolates, which is also marked with numbers. The lines are colored according to the city and the sampling source.

