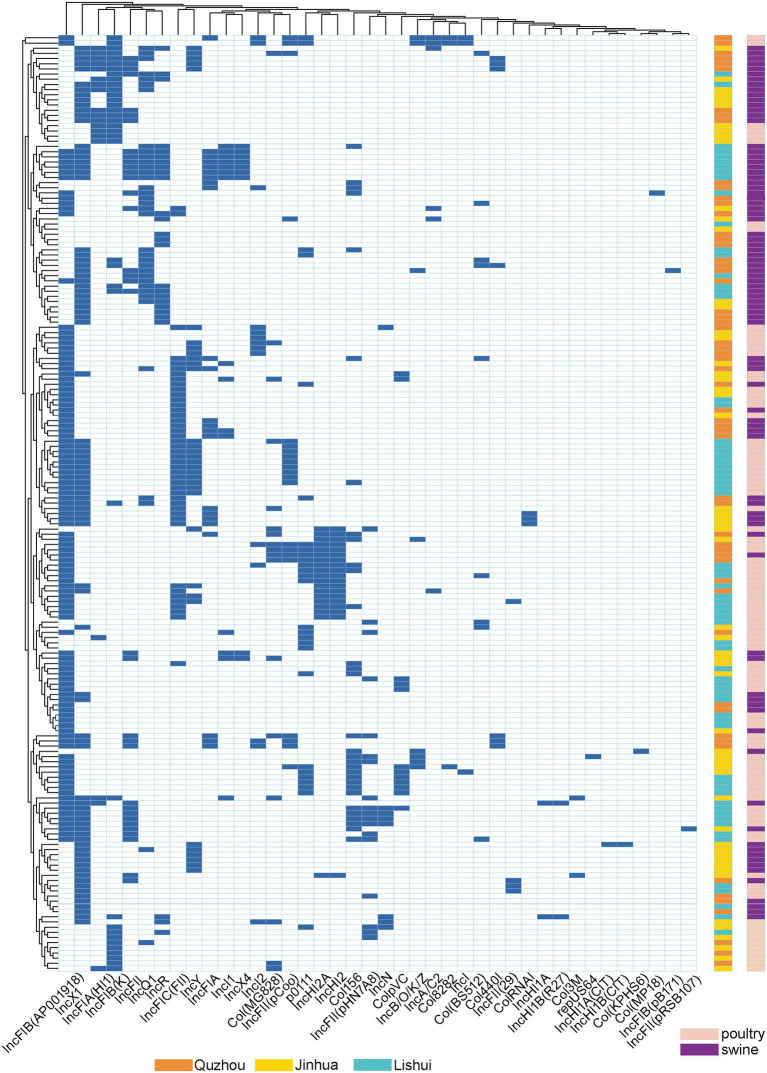
Figure 4.
Dendrogram of hierarchical clustering heatmap of the 181 isolates and 40 plasmid replicons. Y-axis is the isolate number, and x-axis is the selected resistance genes identified. Non-expression of resistance is a white background and resistance phenotype is a blue background. Orange indicates isolates were isolated from Quzhou samples, aqua blue indicates isolates were isolated from Lishui, and bright yellow indicates isolates were isolated from Jinhua. Purple indicates that the strain is isolated from pig anal swab samples, and green indicates that the strain is isolated from bird anal swab samples.

