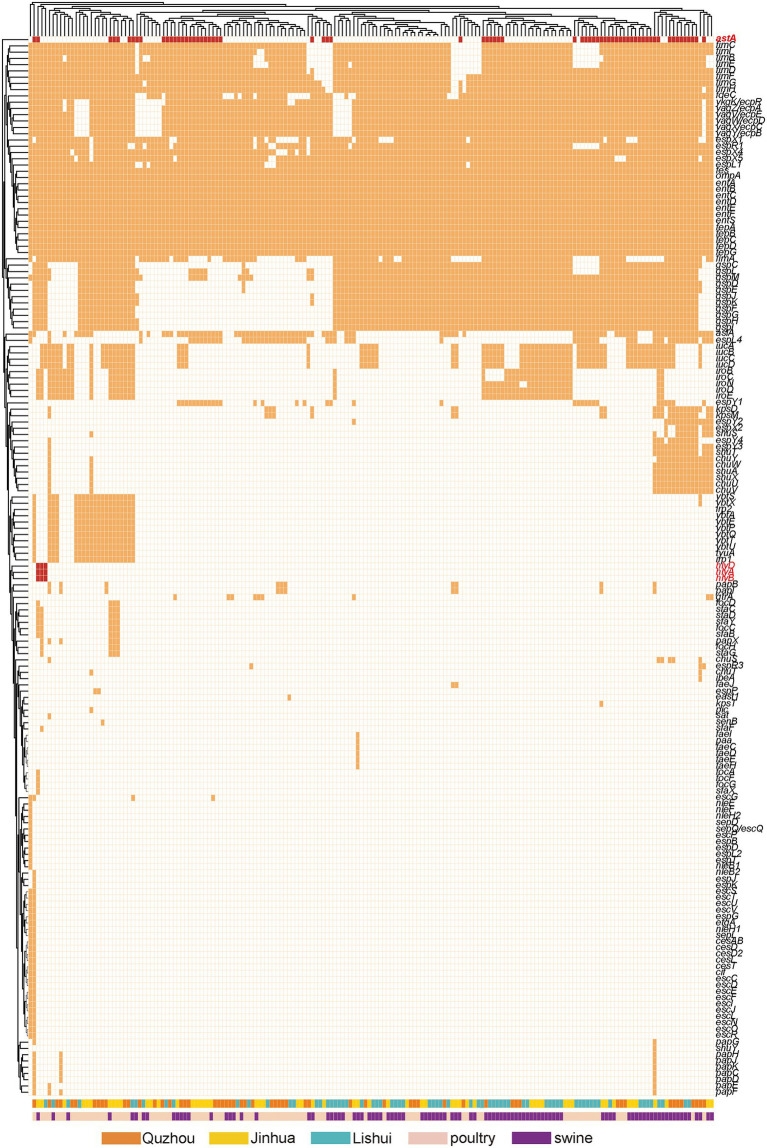
Figure 6.
Dendrogram of the hierarchical clustering heat map of isolates and virulence genes. The figure shows the predicted virulence genes factor profile of the studied isolates. Y-axis is the isolate number and x-axis is the selected virulence genes identified. The red color in the small cells indicates virulence genes associated with toxin production, the orange color indicates genes editing other virulence factors, and the white color indicates no virulence expression. Withered grass color indicates isolates isolated from Quzhou samples, yellow indicates isolates from Jinhua, and blue color indicates isolates from Lishui. Incarnadine pink indicates that the isolates were isolated from pig anal swab samples, and bright green indicates that they were isolated from birds.

