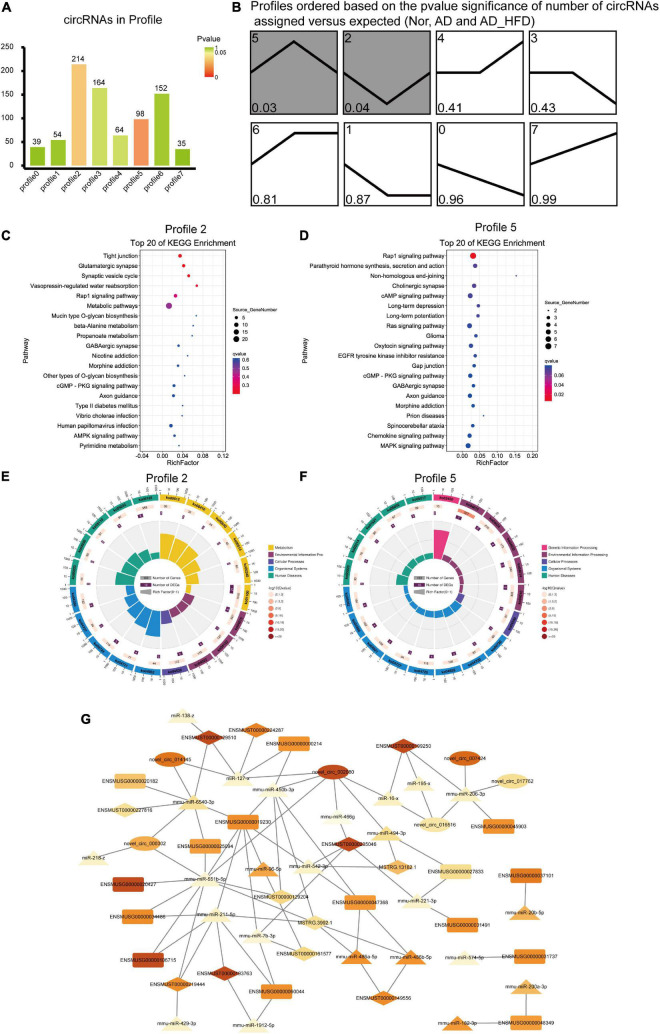
FIGURE 6.
Trend analysis of circRNAs and ceRNA network. (A) The number of circRNAs in profile. Green represents P-value which is closed to 1 and red represents the P-value is closed to 0. (B) Trends analysis of circRNAs among the Nor, AD and AD_HFD groups. Pathways enriched by genes regulated by differentially expressed circRNAs in profile 2 (C) and profile 5 (D). The enrichment circle diagrams of GO enrichment analysis in profile 2 (E) and profile 5 (F). The first circle: enrichment of the first 20 GO term. Different colors represent different ontologies; the second circle: the number and Q-value of the GO term in each classification gene background. The more the number of gene background in each classification, the longer the bar, and the smaller the Q-value, the redder the color. The third circle: the number of genes in each category of the GO term; fourth circle: RichFactor value of each GO term. (G) The Competing Endogenous RNA Network. Rectangle indicates mRNA, ellipse indicates circRNA, and prism indicates lncRNA, triangle indicates miRNA. The larger the FC value, the darker the color.

