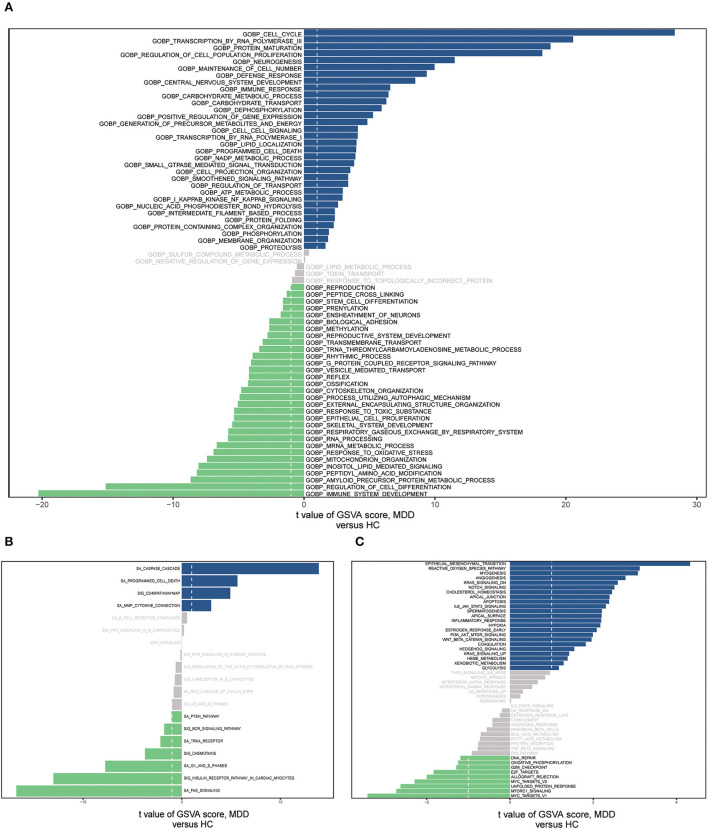
Figure 8.
The gene set variation analysis (GSVA) for two groups based on the GSE98793 database. (A) Bar graph depicting “GO” pathway scores computed by the GSVA. (B) Bar plot of “KEGG” pathway score calculated by GSVA. (C) Bar plot of “Hallmark” pathway score calculated by GSVA.

