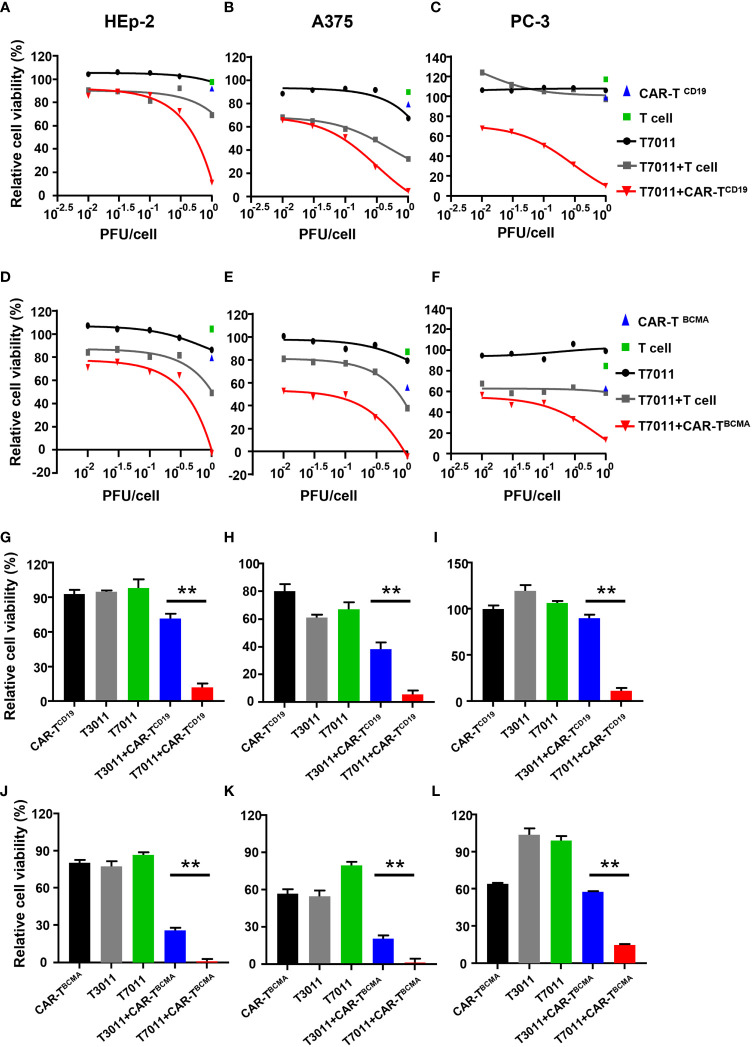
Figure 3.
T7011 introduces CD19 and BCMA on tumor cells, which direct activation and cytotoxicity of CAR-TCD19 and CAR-TBCMA cells. (A-F) HEp-2, A375, and PC-3 cells were infected with T7011 at an indicated MOI of 0.01, 0.03, 0.1, 0.3, or 1 for 24 hours (black line) and then cocultured with untransduced T cells, CD19 specific CAR T cells [CAR-TCD19, (A–C)], or BCMA specific CAR T cells [CAR-TBCMA, (D-F)] at an effector: target (E: T) ratio of 4:1 for 24 hours. Cell viability values for tumor cells cocultured with untransduced T cells (green square) or CAR-TCD19 cells (blue triangle) are indicated by a single data point. The live cells were determined with CellTiter-Glo®. Results are expressed as the mean of the cell viability ± SEM compared to the mock treatment control (as 100%). (G–L) HEp-2, A375, and PC-3 cells were cocultured with CD19-specific CAR T cells [CAR-TCD19, (G–I)], or BCMA-specific CAR T cells [CAR-TBCMA, (J–L)] at an effector: target (E: T) ratio of 4:1 in the presence or absence of infection of T7011 or T3011 at 1 PFU per cell. The live cells were determined with CellTiter-Glo®. Results are expressed as the mean of the cell viability ± SEM compared to the mock treatment control (as 100%). Statistically significant differences are indicated by an asterisk (**p < 0.01).

