
. 2022 Nov 5;84(12):144. doi: 10.1007/s11538-022-01102-7
© The Author(s), under exclusive licence to Society for Mathematical Biology 2022, Springer Nature or its licensor (e.g. a society or other partner) holds exclusive rights to this article under a publishing agreement with the author(s) or other rightsholder(s); author self-archiving of the accepted manuscript version of this article is solely governed by the terms of such publishing agreement and applicable law.
This article is made available via the PMC Open Access Subset for unrestricted research re-use and secondary analysis in any form or by any means with acknowledgement of the original source. These permissions are granted for the duration of the World Health Organization (WHO) declaration of COVID-19 as a global pandemic.
Fig. 11.
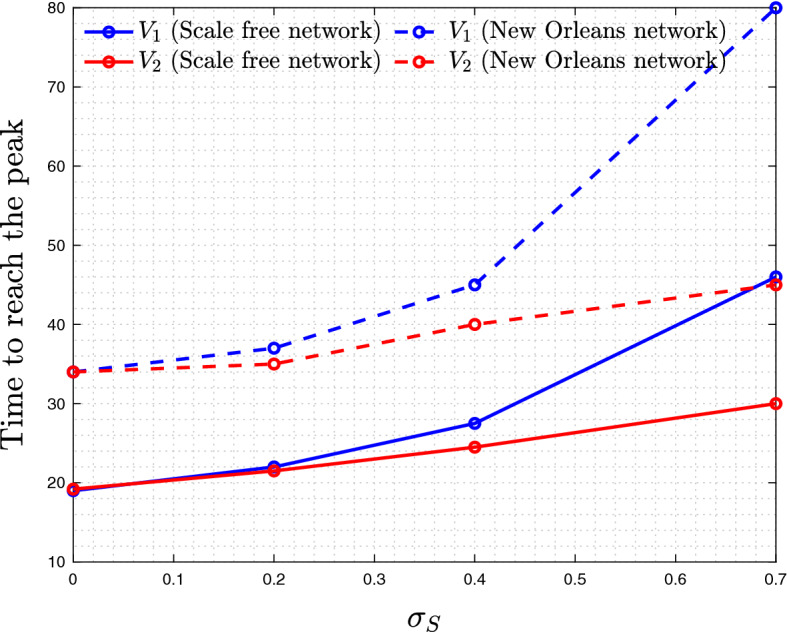
(Color figure online) Time to reach infection peak for viruses (blue) and (red), as a function of (the measure of advantage)