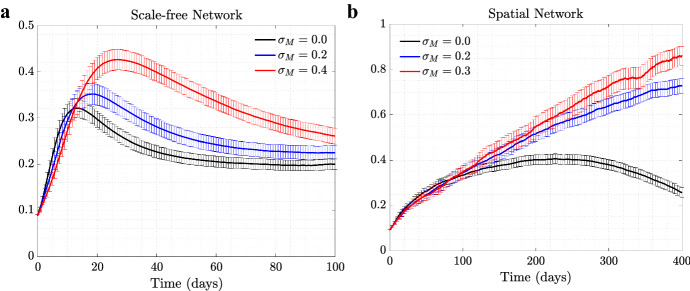
Fig. 3.
(Color figure online) The effect of mandated SD on the proportion of . The proportion of the asymptomatic strain, , is shown as a function time, for three different levels of mandated SD: a Scale-free network, (black), (blue), and , with ; b spatial network, (black), (blue), and (red), with . All the other parameters are as in Fig. 1. The levels for mandated and self-regulated SD are selected in such a way that remains above one so an outbreak for is observed

