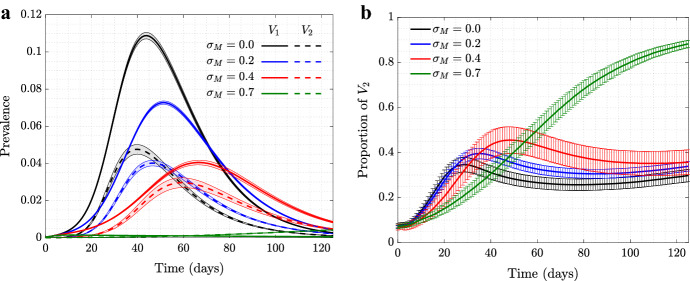
Fig. 7.
(Color figure online) New Orleans Network of size 150, 000 individuals: the role of mandated SD in the spread of viruses. Time series are shown for four scenarios of no (, black), low (, blue), moderate (, red), and high (, green) mandated SD, in the presence of moderate self-regulated SD (). a plot is the prevalence of (solid) and (dashed); b shows the proportion of (). and all the other parameters are as in Fig. 1 (corresponding to ). Means and standard errors are shown for 1000 stochastic realizations

