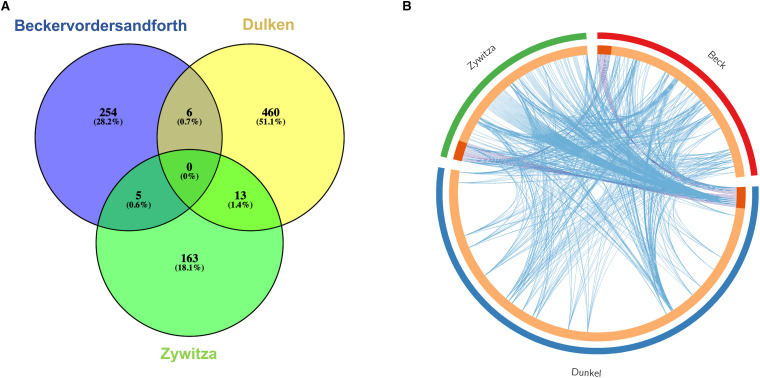
Figure 1.
(A) Venn diagram for DEGs between NSC and astrocyte populations from the three studies, Beckervordersandforth et al. (2010; blue), Dulken et al. (2017; yellow) and Zywitza et al. (2018; green). Each list represents a direct comparison in gene expression between NSCs and astrocytes in the reference study. (B) Circos plot for the same gene lists as (A), representing shared genes (shaded orange and purple lines) and shared GO terms (blue lines). GO enrichment analysis performed in Metascape.
DEG = differentially expressed genes; NSC = neural stem cell; GO = gene ontology.

